29
/
en
AIzaSyAYiBZKx7MnpbEhh9jyipgxe19OcubqV5w
April 1, 2024
26195
Central Europe and the Baltics
CEB
false
2
1
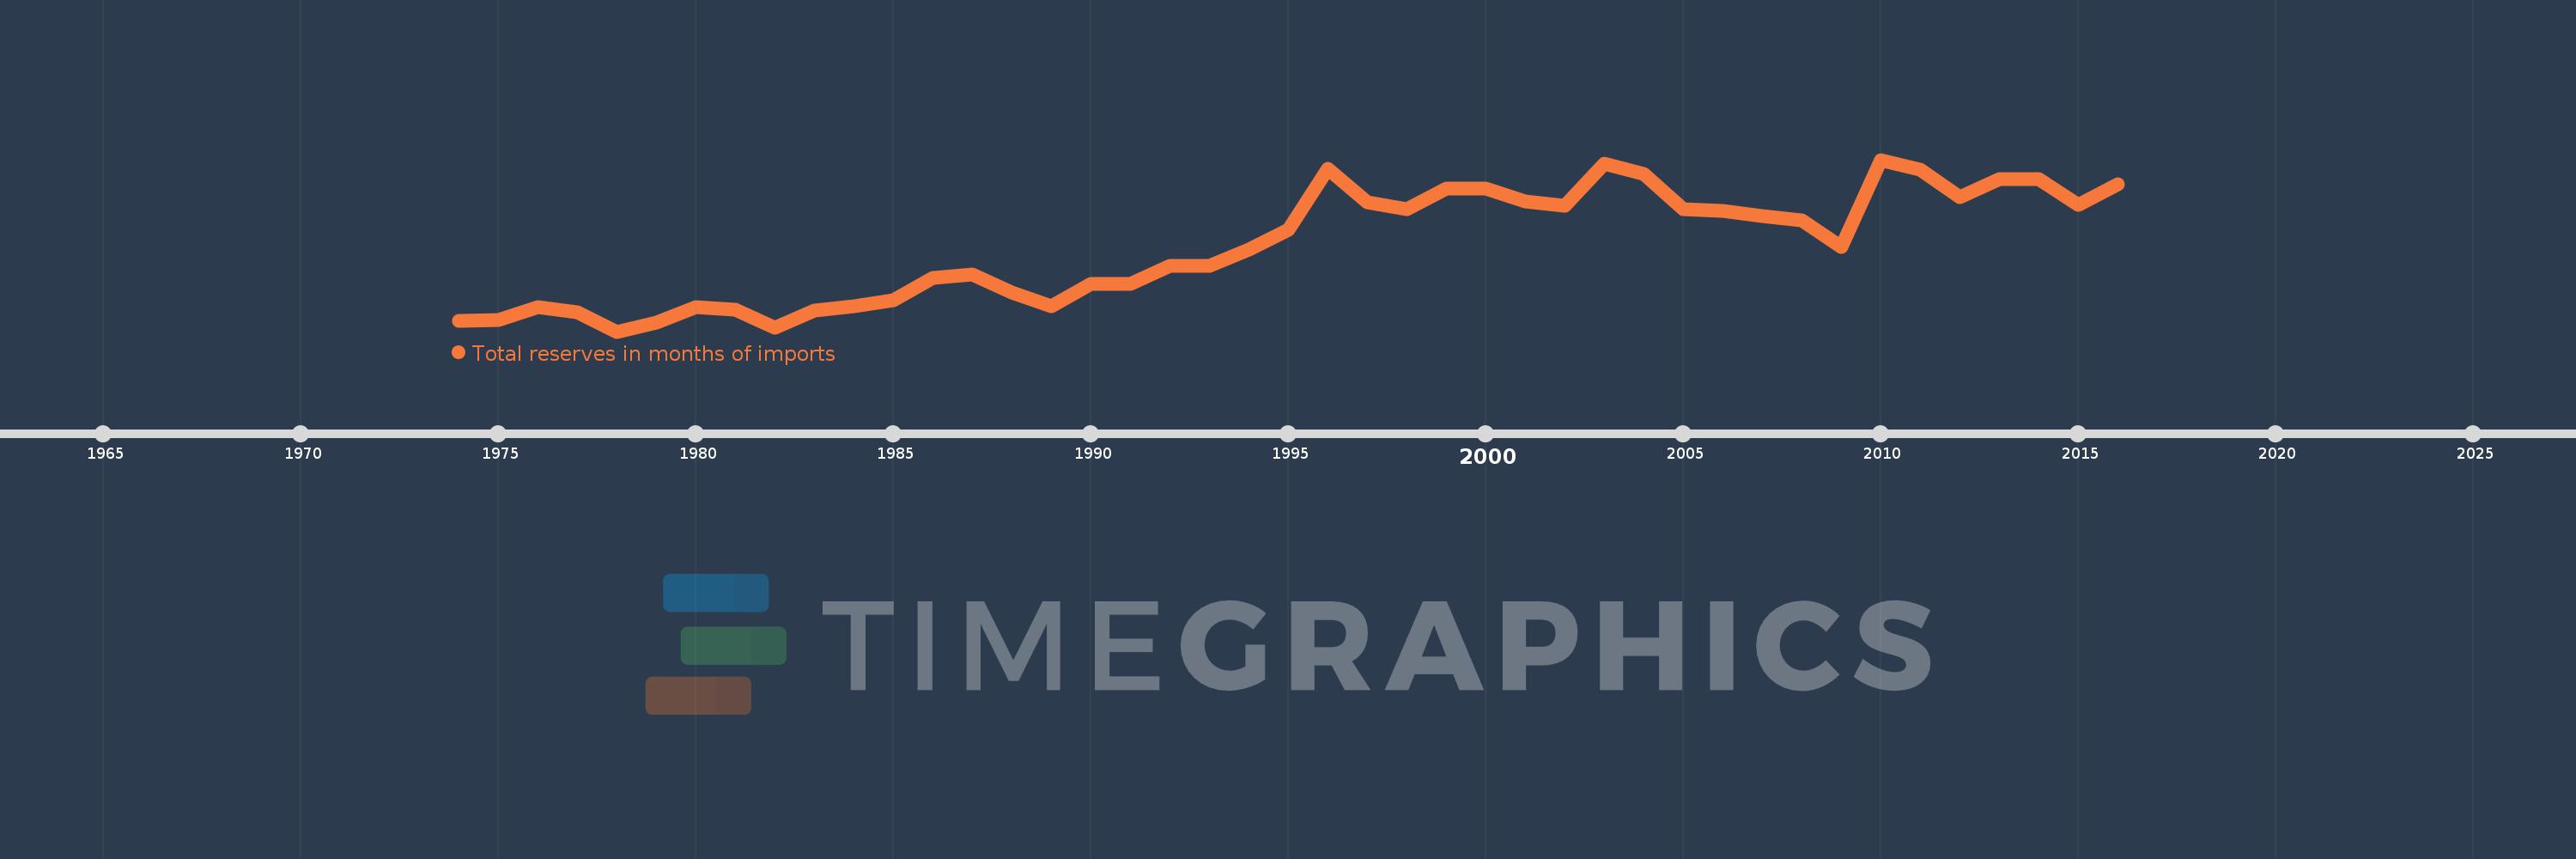
Total reserves in months of imports
2016,2015,2014,2013,2012,2011,2010,2009,2008,2007,2006,2005,2004,2003,2002,2001,2000,1999,1998,1997,1996,1995,1994,1993,1992,1991,1990,1989,1988,1987,1986,1985,1984,1983,1982,1981,1980,1979,1978,1977,1976,1975,1974
This statistics in other country:
AfghanistanAlbaniaAlgeriaAngolaAntigua and BarbudaArab WorldArgentinaArmeniaArubaAustraliaAustriaAzerbaijanBahamas, TheBahrainBangladeshBarbadosBelarusBelgiumBelizeBeninBhutanBoliviaBosnia and HerzegovinaBotswanaBrazilBrunei DarussalamBulgariaBurkina FasoBurundiCabo VerdeCambodiaCameroonCanadaCaribbean small statesCentral African RepublicCentral Europe and the BalticsChadChileChinaColombiaComorosCongo, Dem. Rep.Congo, Rep.Costa RicaCote d'IvoireCroatiaCuracaoCyprusCzech RepublicDenmarkDjiboutiDominicaDominican RepublicEarly-demographic dividendEast Asia & PacificEast Asia & Pacific (excluding high income)East Asia & Pacific (IDA & IBRD countries)EcuadorEgypt, Arab Rep.El SalvadorEquatorial GuineaEritreaEstoniaEthiopiaEuro areaEurope & Central AsiaEurope & Central Asia (excluding high income)Europe & Central Asia (IDA & IBRD countries)European UnionFijiFinlandFragile and conflict affected situationsFranceGabonGambia, TheGeorgiaGermanyGhanaGreeceGrenadaGuatemalaGuineaGuinea-BissauGuyanaHaitiHeavily indebted poor countries (HIPC)High incomeHondurasHong Kong SAR, ChinaHungaryIBRD onlyIcelandIDA & IBRD totalIDA blendIDA onlyIDA totalIndiaIndonesiaIran, Islamic Rep.IraqIrelandIsraelItalyJamaicaJapanJordanKazakhstanKenyaKorea, Rep.KosovoKuwaitKyrgyz RepublicLao PDRLate-demographic dividendLatin America & Caribbean Latin America & Caribbean (excluding high income)Latin America & the Caribbean (IDA & IBRD countries)LatviaLeast developed countries: UN classificationLebanonLesothoLiberiaLibyaLithuaniaLow & middle incomeLow incomeLower middle incomeLuxembourgMacao SAR, ChinaMacedonia, FYRMadagascarMalawiMalaysiaMaldivesMaliMaltaMauritaniaMauritiusMexicoMicronesia, Fed. Sts.Middle East & North AfricaMiddle East & North Africa (excluding high income)Middle East & North Africa (IDA & IBRD countries)Middle incomeMoldovaMongoliaMontenegroMoroccoMozambiqueMyanmarNamibiaNepalNetherlandsNicaraguaNigerNigeriaNorth AmericaNorwayOECD membersOmanOther small statesPacific island small statesPakistanPanamaPapua New GuineaParaguayPeruPhilippinesPolandPortugalPost-demographic dividendPre-demographic dividendQatarRomaniaRussian FederationRwandaSamoaSao Tome and PrincipeSaudi ArabiaSenegalSerbiaSeychellesSierra LeoneSingaporeSlovak RepublicSloveniaSmall statesSolomon IslandsSouth AfricaSouth AsiaSouth Asia (IDA & IBRD)South SudanSpainSri LankaSt. Kitts and NevisSt. LuciaSt. Vincent and the GrenadinesSub-Saharan Africa Sub-Saharan Africa (excluding high income)Sub-Saharan Africa (IDA & IBRD countries)SudanSurinameSwazilandSwedenSwitzerlandSyrian Arab RepublicTajikistanTanzaniaThailandTimor-LesteTogoTongaTrinidad and TobagoTunisiaTurkeyUgandaUkraineUnited KingdomUnited StatesUpper middle incomeUruguayVanuatuVenezuela, RBVietnamWest Bank and GazaWorldYemen, Rep.ZambiaZimbabwe Timeline:
This timeline shows a graph from 1974 to 2016 of Central Europe and the Baltics. No data until 1973. Number of actual observations by date: 43.
Source name:
World Development Indicators
Source organization:
International Monetary Fund, International Financial Statistics and data files.
Categories, topics:
Financial Sector, External Debt
Last updated:
apr 23, 2017
Indicators value changes by year
At the date of observation
Value
Absolute change
Change from previous value
jan 1, 1974
1.458
+1.458
0.0%
jan 1, 1975
1.479
+0.021
1.43%
jan 1, 1976
1.816
+0.337
22.77%
jan 1, 1977
1.671
-0.145
-8.01%
jan 1, 1978
1.184
-0.487
-29.15%
jan 1, 1979
1.424
+0.24
20.31%
jan 1, 1980
1.812
+0.388
27.23%
jan 1, 1981
1.745
-0.067
-3.67%
jan 1, 1982
1.28
-0.466
-26.68%
jan 1, 1983
1.72
+0.44
34.42%
jan 1, 1984
1.833
+0.113
6.59%
jan 1, 1985
1.991
+0.157
8.59%
jan 1, 1986
2.546
+0.555
27.88%
jan 1, 1987
2.646
+0.1
3.94%
jan 1, 1988
2.179
-0.467
-17.66%
jan 1, 1989
1.825
-0.354
-16.25%
jan 1, 1990
2.404
+0.58
31.78%
jan 1, 1991
2.398
-0.006
-0.26%
jan 1, 1992
2.852
+0.454
18.92%
jan 1, 1993
2.851
-0.001
-0.03%
jan 1, 1994
3.263
+0.412
14.44%
jan 1, 1995
3.781
+0.519
15.89%
jan 1, 1996
5.319
+1.538
40.68%
jan 1, 1997
4.483
-0.836
-15.72%
jan 1, 1998
4.3
-0.183
-4.07%
jan 1, 1999
4.832
+0.532
12.37%
jan 1, 2000
4.834
+0.002
0.04%
jan 1, 2001
4.504
-0.33
-6.84%
jan 1, 2002
4.384
-0.12
-2.66%
jan 1, 2003
5.466
+1.082
24.68%
jan 1, 2004
5.195
-0.271
-4.96%
jan 1, 2005
4.291
-0.904
-17.41%
jan 1, 2006
4.262
-0.029
-0.67%
jan 1, 2007
4.133
-0.129
-3.04%
jan 1, 2008
4.012
-0.12
-2.91%
jan 1, 2009
3.345
-0.668
-16.64%
jan 1, 2010
5.557
+2.213
66.16%
jan 1, 2011
5.309
-0.248
-4.47%
jan 1, 2012
4.606
-0.703
-13.24%
jan 1, 2013
5.072
+0.466
10.12%
jan 1, 2014
5.065
-0.006
-0.13%
jan 1, 2015
4.406
-0.66
-13.03%
jan 1, 2016
4.933
+0.528
11.98%
Ranking of countries by current statistics by years


Comments: