29
/
en
AIzaSyAYiBZKx7MnpbEhh9jyipgxe19OcubqV5w
April 1, 2024
139856
Germany
DEU
true
2
1
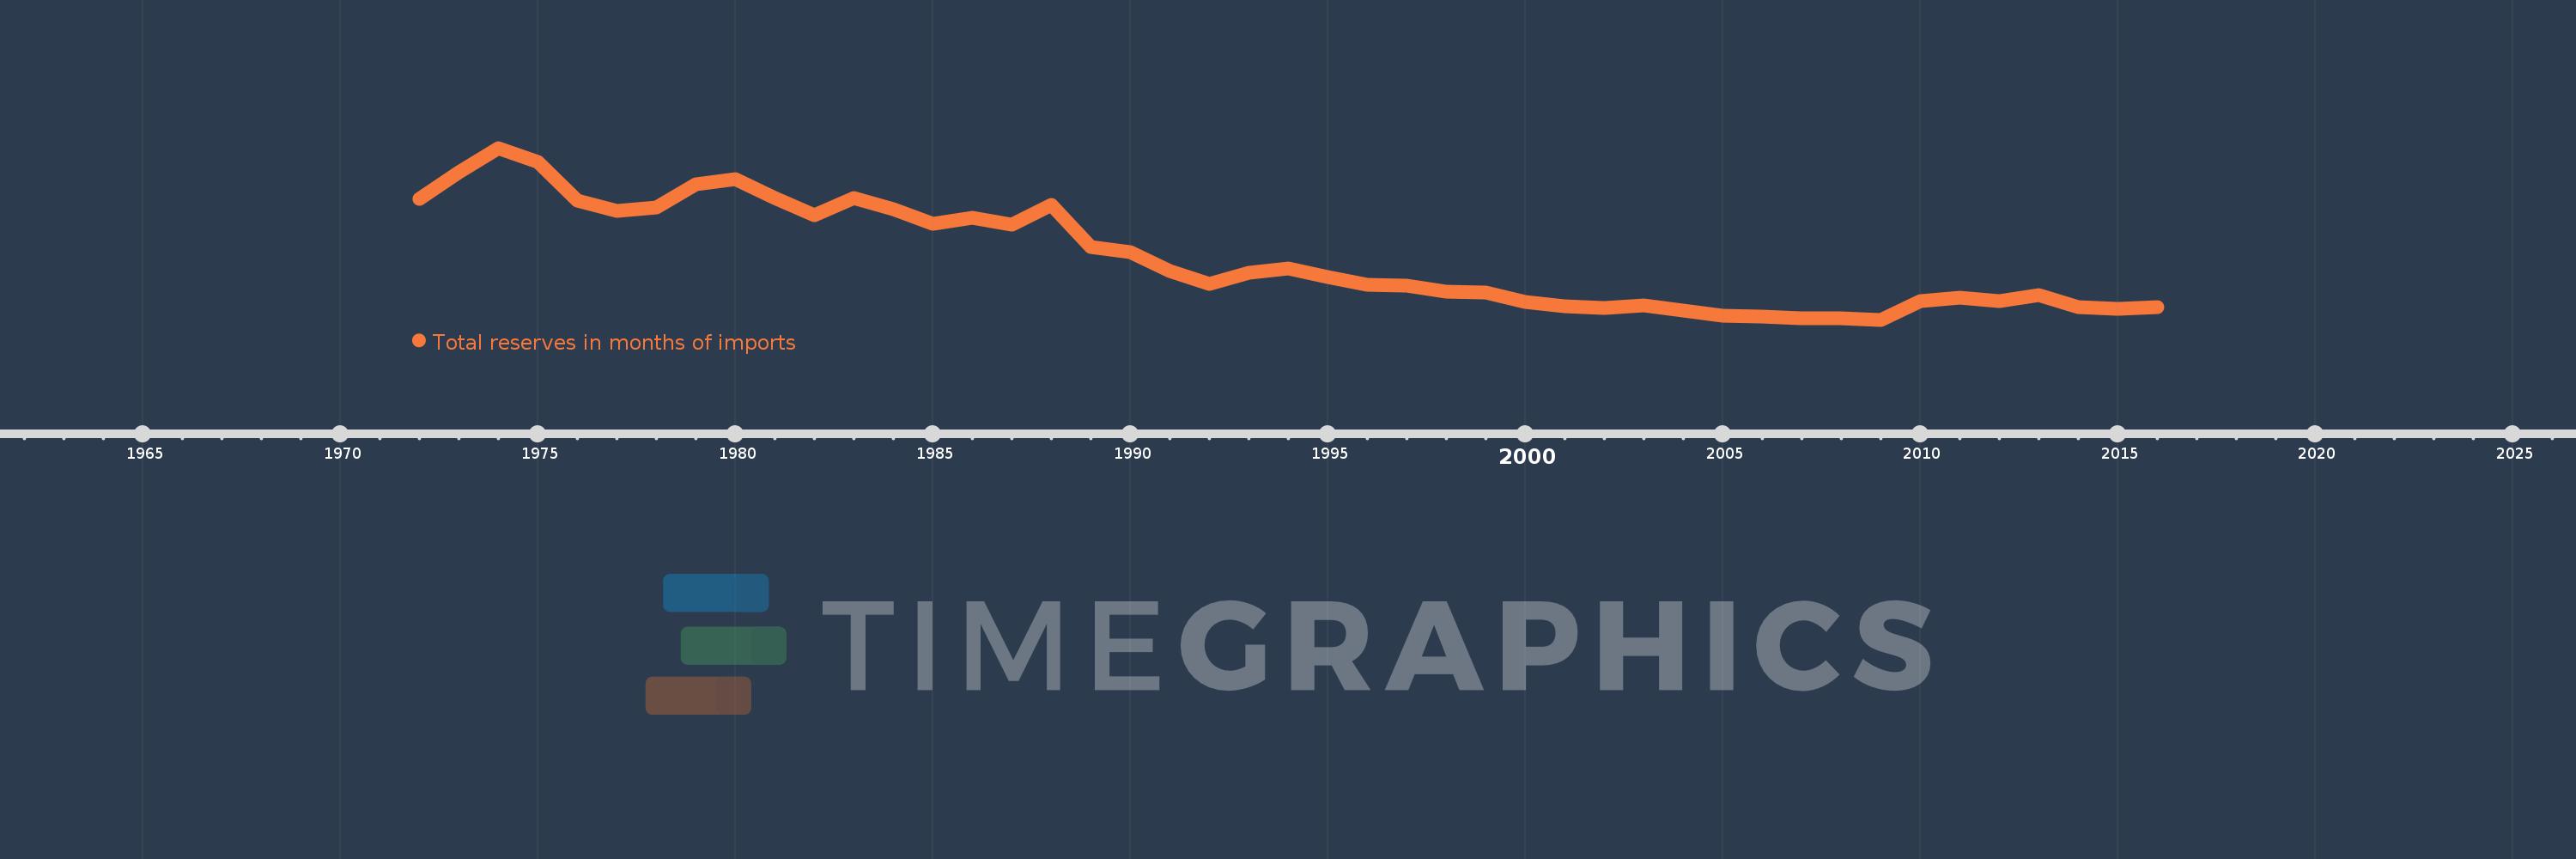
Total reserves in months of imports
2016,2015,2014,2013,2012,2011,2010,2009,2008,2007,2006,2005,2004,2003,2002,2001,2000,1999,1998,1997,1996,1995,1994,1993,1992,1991,1990,1989,1988,1987,1986,1985,1984,1983,1982,1981,1980,1979,1978,1977,1976,1975,1974,1973,1972
This statistics in other country:
AfghanistanAlbaniaAlgeriaAngolaAntigua and BarbudaArab WorldArgentinaArmeniaArubaAustraliaAustriaAzerbaijanBahamas, TheBahrainBangladeshBarbadosBelarusBelgiumBelizeBeninBhutanBoliviaBosnia and HerzegovinaBotswanaBrazilBrunei DarussalamBulgariaBurkina FasoBurundiCabo VerdeCambodiaCameroonCanadaCaribbean small statesCentral African RepublicCentral Europe and the BalticsChadChileChinaColombiaComorosCongo, Dem. Rep.Congo, Rep.Costa RicaCote d'IvoireCroatiaCuracaoCyprusCzech RepublicDenmarkDjiboutiDominicaDominican RepublicEarly-demographic dividendEast Asia & PacificEast Asia & Pacific (excluding high income)East Asia & Pacific (IDA & IBRD countries)EcuadorEgypt, Arab Rep.El SalvadorEquatorial GuineaEritreaEstoniaEthiopiaEuro areaEurope & Central AsiaEurope & Central Asia (excluding high income)Europe & Central Asia (IDA & IBRD countries)European UnionFijiFinlandFragile and conflict affected situationsFranceGabonGambia, TheGeorgiaGermanyGhanaGreeceGrenadaGuatemalaGuineaGuinea-BissauGuyanaHaitiHeavily indebted poor countries (HIPC)High incomeHondurasHong Kong SAR, ChinaHungaryIBRD onlyIcelandIDA & IBRD totalIDA blendIDA onlyIDA totalIndiaIndonesiaIran, Islamic Rep.IraqIrelandIsraelItalyJamaicaJapanJordanKazakhstanKenyaKorea, Rep.KosovoKuwaitKyrgyz RepublicLao PDRLate-demographic dividendLatin America & Caribbean Latin America & Caribbean (excluding high income)Latin America & the Caribbean (IDA & IBRD countries)LatviaLeast developed countries: UN classificationLebanonLesothoLiberiaLibyaLithuaniaLow & middle incomeLow incomeLower middle incomeLuxembourgMacao SAR, ChinaMacedonia, FYRMadagascarMalawiMalaysiaMaldivesMaliMaltaMauritaniaMauritiusMexicoMicronesia, Fed. Sts.Middle East & North AfricaMiddle East & North Africa (excluding high income)Middle East & North Africa (IDA & IBRD countries)Middle incomeMoldovaMongoliaMontenegroMoroccoMozambiqueMyanmarNamibiaNepalNetherlandsNicaraguaNigerNigeriaNorth AmericaNorwayOECD membersOmanOther small statesPacific island small statesPakistanPanamaPapua New GuineaParaguayPeruPhilippinesPolandPortugalPost-demographic dividendPre-demographic dividendQatarRomaniaRussian FederationRwandaSamoaSao Tome and PrincipeSaudi ArabiaSenegalSerbiaSeychellesSierra LeoneSingaporeSlovak RepublicSloveniaSmall statesSolomon IslandsSouth AfricaSouth AsiaSouth Asia (IDA & IBRD)South SudanSpainSri LankaSt. Kitts and NevisSt. LuciaSt. Vincent and the GrenadinesSub-Saharan Africa Sub-Saharan Africa (excluding high income)Sub-Saharan Africa (IDA & IBRD countries)SudanSurinameSwazilandSwedenSwitzerlandSyrian Arab RepublicTajikistanTanzaniaThailandTimor-LesteTogoTongaTrinidad and TobagoTunisiaTurkeyUgandaUkraineUnited KingdomUnited StatesUpper middle incomeUruguayVanuatuVenezuela, RBVietnamWest Bank and GazaWorldYemen, Rep.ZambiaZimbabwe Timeline:
This timeline shows a graph from 1972 to 2016 of Germany. No data until 1971. Number of actual observations by date: 45.
Source name:
World Development Indicators
Source organization:
International Monetary Fund, International Financial Statistics and data files.
Categories, topics:
Financial Sector, External Debt
Last updated:
apr 23, 2017
Indicators value changes by year
At the date of observation
Value
Absolute change
Change from previous value
jan 1, 1972
5.256
+5.256
0.0%
jan 1, 1973
6.187
+0.931
17.72%
jan 1, 1974
7.05
+0.863
13.95%
jan 1, 1975
6.565
-0.486
-6.89%
jan 1, 1976
5.191
-1.373
-20.92%
jan 1, 1977
4.846
-0.345
-6.64%
jan 1, 1978
4.965
+0.119
2.45%
jan 1, 1979
5.769
+0.804
16.2%
jan 1, 1980
5.95
+0.18
3.12%
jan 1, 1981
5.297
-0.653
-10.97%
jan 1, 1982
4.672
-0.625
-11.8%
jan 1, 1983
5.292
+0.62
13.27%
jan 1, 1984
4.902
-0.39
-7.37%
jan 1, 1985
4.388
-0.514
-10.49%
jan 1, 1986
4.6
+0.212
4.83%
jan 1, 1987
4.344
-0.256
-5.56%
jan 1, 1988
5.03
+0.686
15.8%
jan 1, 1989
3.567
-1.463
-29.08%
jan 1, 1990
3.365
-0.202
-5.67%
jan 1, 1991
2.723
-0.642
-19.08%
jan 1, 1992
2.246
-0.477
-17.5%
jan 1, 1993
2.654
+0.408
18.14%
jan 1, 1994
2.801
+0.147
5.56%
jan 1, 1995
2.515
-0.287
-10.23%
jan 1, 1996
2.232
-0.283
-11.27%
jan 1, 1997
2.195
-0.036
-1.63%
jan 1, 1998
1.998
-0.198
-9.0%
jan 1, 1999
1.942
-0.055
-2.77%
jan 1, 2000
1.614
-0.329
-16.91%
jan 1, 2001
1.463
-0.151
-9.35%
jan 1, 2002
1.413
-0.05
-3.39%
jan 1, 2003
1.497
+0.083
5.9%
jan 1, 2004
1.33
-0.167
-11.17%
jan 1, 2005
1.15
-0.18
-13.53%
jan 1, 2006
1.093
-0.057
-4.92%
jan 1, 2007
1.039
-0.054
-4.98%
jan 1, 2008
1.06
+0.021
2.0%
jan 1, 2009
0.996
-0.064
-6.01%
jan 1, 2010
1.647
+0.651
65.33%
jan 1, 2011
1.771
+0.125
7.57%
jan 1, 2012
1.64
-0.131
-7.4%
jan 1, 2013
1.875
+0.235
14.34%
jan 1, 2014
1.444
-0.432
-23.02%
jan 1, 2015
1.374
-0.07
-4.84%
jan 1, 2016
1.427
+0.053
3.84%
Ranking of countries by current statistics by years


Comments: