29
/
en
AIzaSyAYiBZKx7MnpbEhh9jyipgxe19OcubqV5w
April 1, 2024
134684
France
FRA
true
2
1
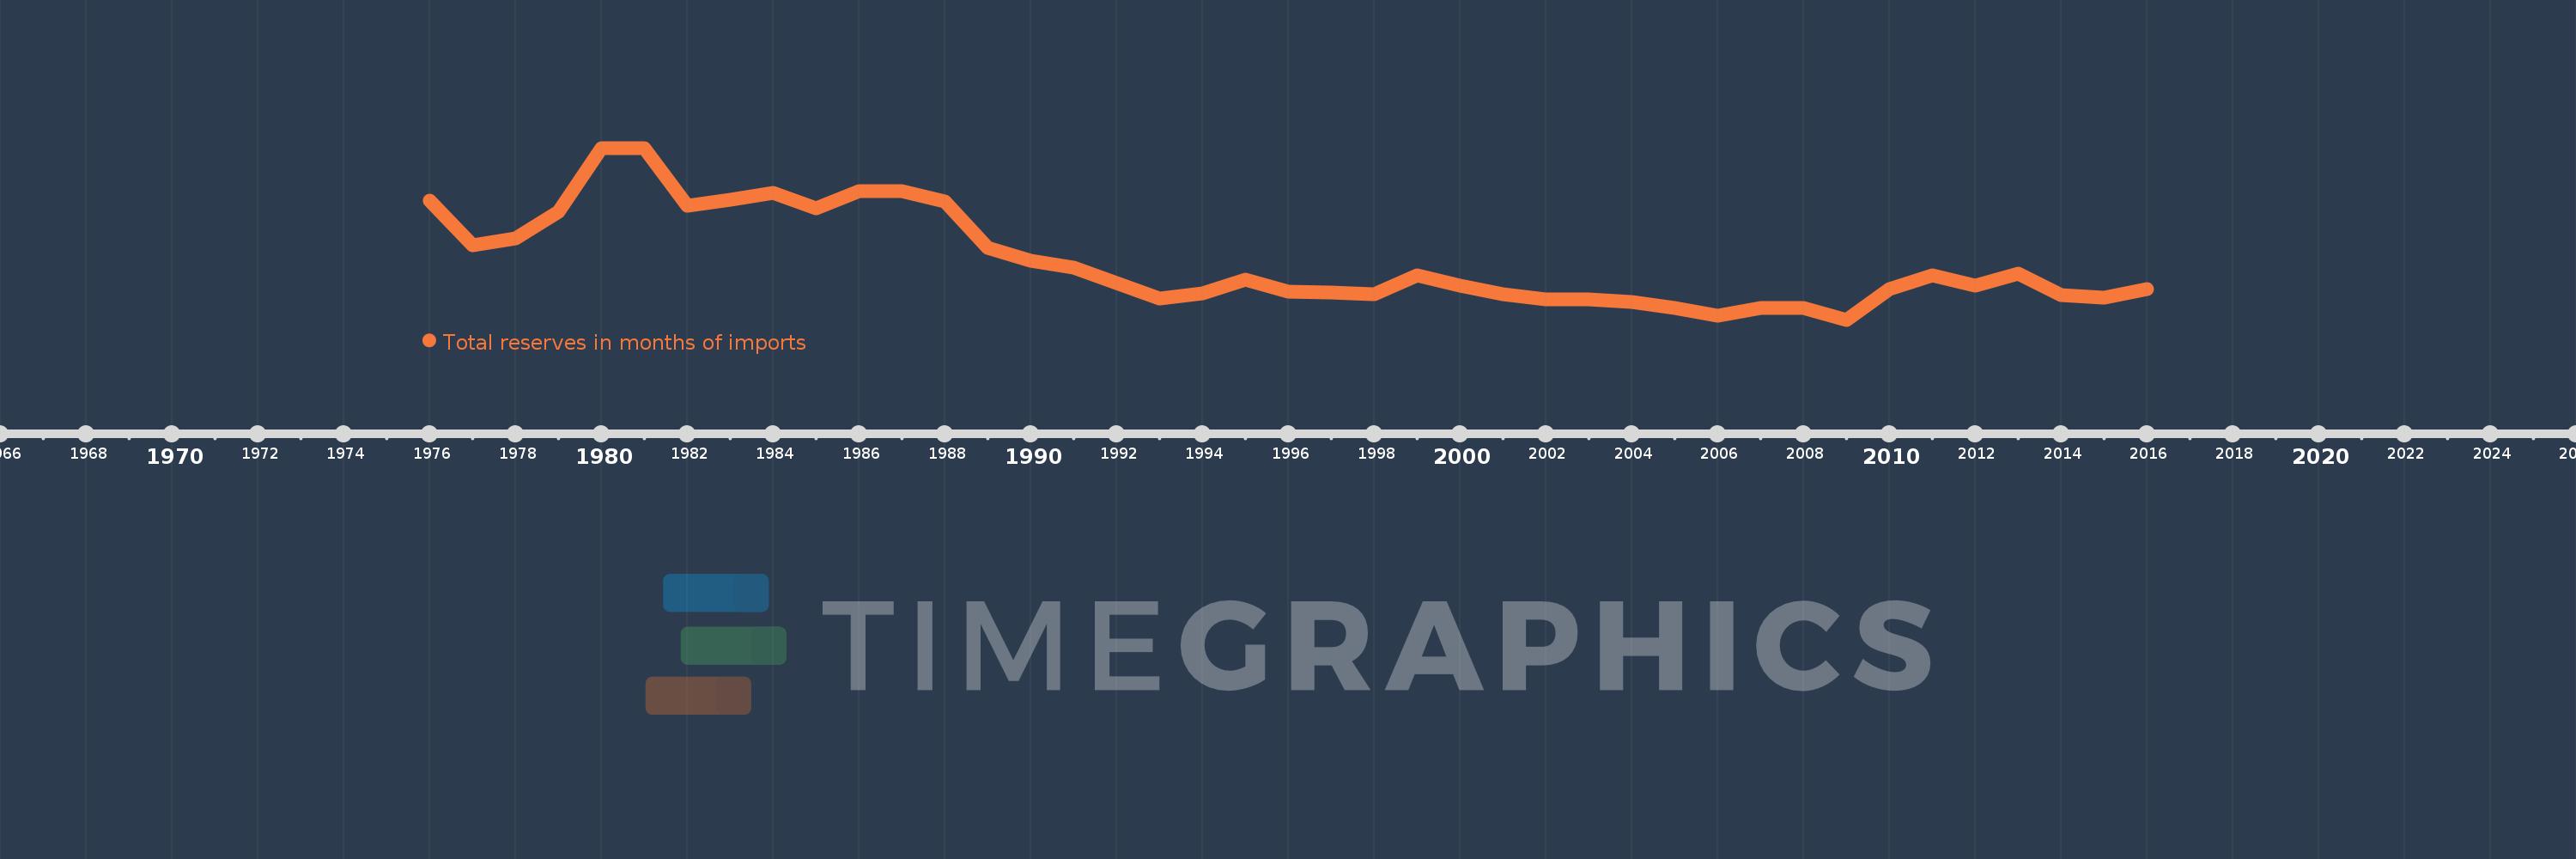
Total reserves in months of imports
2016,2015,2014,2013,2012,2011,2010,2009,2008,2007,2006,2005,2004,2003,2002,2001,2000,1999,1998,1997,1996,1995,1994,1993,1992,1991,1990,1989,1988,1987,1986,1985,1984,1983,1982,1981,1980,1979,1978,1977,1976
This statistics in other country:
AfghanistanAlbaniaAlgeriaAngolaAntigua and BarbudaArab WorldArgentinaArmeniaArubaAustraliaAustriaAzerbaijanBahamas, TheBahrainBangladeshBarbadosBelarusBelgiumBelizeBeninBhutanBoliviaBosnia and HerzegovinaBotswanaBrazilBrunei DarussalamBulgariaBurkina FasoBurundiCabo VerdeCambodiaCameroonCanadaCaribbean small statesCentral African RepublicCentral Europe and the BalticsChadChileChinaColombiaComorosCongo, Dem. Rep.Congo, Rep.Costa RicaCote d'IvoireCroatiaCuracaoCyprusCzech RepublicDenmarkDjiboutiDominicaDominican RepublicEarly-demographic dividendEast Asia & PacificEast Asia & Pacific (excluding high income)East Asia & Pacific (IDA & IBRD countries)EcuadorEgypt, Arab Rep.El SalvadorEquatorial GuineaEritreaEstoniaEthiopiaEuro areaEurope & Central AsiaEurope & Central Asia (excluding high income)Europe & Central Asia (IDA & IBRD countries)European UnionFijiFinlandFragile and conflict affected situationsFranceGabonGambia, TheGeorgiaGermanyGhanaGreeceGrenadaGuatemalaGuineaGuinea-BissauGuyanaHaitiHeavily indebted poor countries (HIPC)High incomeHondurasHong Kong SAR, ChinaHungaryIBRD onlyIcelandIDA & IBRD totalIDA blendIDA onlyIDA totalIndiaIndonesiaIran, Islamic Rep.IraqIrelandIsraelItalyJamaicaJapanJordanKazakhstanKenyaKorea, Rep.KosovoKuwaitKyrgyz RepublicLao PDRLate-demographic dividendLatin America & Caribbean Latin America & Caribbean (excluding high income)Latin America & the Caribbean (IDA & IBRD countries)LatviaLeast developed countries: UN classificationLebanonLesothoLiberiaLibyaLithuaniaLow & middle incomeLow incomeLower middle incomeLuxembourgMacao SAR, ChinaMacedonia, FYRMadagascarMalawiMalaysiaMaldivesMaliMaltaMauritaniaMauritiusMexicoMicronesia, Fed. Sts.Middle East & North AfricaMiddle East & North Africa (excluding high income)Middle East & North Africa (IDA & IBRD countries)Middle incomeMoldovaMongoliaMontenegroMoroccoMozambiqueMyanmarNamibiaNepalNetherlandsNicaraguaNigerNigeriaNorth AmericaNorwayOECD membersOmanOther small statesPacific island small statesPakistanPanamaPapua New GuineaParaguayPeruPhilippinesPolandPortugalPost-demographic dividendPre-demographic dividendQatarRomaniaRussian FederationRwandaSamoaSao Tome and PrincipeSaudi ArabiaSenegalSerbiaSeychellesSierra LeoneSingaporeSlovak RepublicSloveniaSmall statesSolomon IslandsSouth AfricaSouth AsiaSouth Asia (IDA & IBRD)South SudanSpainSri LankaSt. Kitts and NevisSt. LuciaSt. Vincent and the GrenadinesSub-Saharan Africa Sub-Saharan Africa (excluding high income)Sub-Saharan Africa (IDA & IBRD countries)SudanSurinameSwazilandSwedenSwitzerlandSyrian Arab RepublicTajikistanTanzaniaThailandTimor-LesteTogoTongaTrinidad and TobagoTunisiaTurkeyUgandaUkraineUnited KingdomUnited StatesUpper middle incomeUruguayVanuatuVenezuela, RBVietnamWest Bank and GazaWorldYemen, Rep.ZambiaZimbabwe Timeline:
This timeline shows a graph from 1976 to 2016 of France. No data until 1975. Number of actual observations by date: 41.
Source name:
World Development Indicators
Source organization:
International Monetary Fund, International Financial Statistics and data files.
Categories, topics:
Financial Sector, External Debt
Last updated:
apr 23, 2017
Indicators value changes by year
At the date of observation
Value
Absolute change
Change from previous value
jan 1, 1976
3.989
+3.989
0.0%
jan 1, 1977
2.913
-1.076
-26.97%
jan 1, 1978
3.079
+0.165
5.68%
jan 1, 1979
3.733
+0.654
21.26%
jan 1, 1980
5.249
+1.516
40.6%
jan 1, 1981
5.256
+0.007
0.14%
jan 1, 1982
3.876
-1.381
-26.27%
jan 1, 1983
4.011
+0.136
3.51%
jan 1, 1984
4.176
+0.164
4.1%
jan 1, 1985
3.801
-0.375
-8.98%
jan 1, 1986
4.22
+0.42
11.04%
jan 1, 1987
4.211
-0.009
-0.22%
jan 1, 1988
3.963
-0.247
-5.88%
jan 1, 1989
2.857
-1.107
-27.92%
jan 1, 1990
2.55
-0.307
-10.74%
jan 1, 1991
2.39
-0.159
-6.25%
jan 1, 1992
2.018
-0.372
-15.57%
jan 1, 1993
1.654
-0.364
-18.04%
jan 1, 1994
1.775
+0.121
7.32%
jan 1, 1995
2.098
+0.323
18.2%
jan 1, 1996
1.81
-0.288
-13.74%
jan 1, 1997
1.78
-0.03
-1.67%
jan 1, 1998
1.758
-0.022
-1.24%
jan 1, 1999
2.192
+0.434
24.72%
jan 1, 2000
1.945
-0.248
-11.29%
jan 1, 2001
1.747
-0.197
-10.14%
jan 1, 2002
1.616
-0.132
-7.55%
jan 1, 2003
1.624
+0.009
0.54%
jan 1, 2004
1.559
-0.066
-4.04%
jan 1, 2005
1.428
-0.131
-8.39%
jan 1, 2006
1.224
-0.204
-14.31%
jan 1, 2007
1.42
+0.196
16.04%
jan 1, 2008
1.412
-0.007
-0.51%
jan 1, 2009
1.137
-0.276
-19.51%
jan 1, 2010
1.864
+0.727
63.92%
jan 1, 2011
2.202
+0.339
18.16%
jan 1, 2012
1.947
-0.255
-11.59%
jan 1, 2013
2.244
+0.297
15.25%
jan 1, 2014
1.72
-0.524
-23.34%
jan 1, 2015
1.672
-0.049
-2.82%
jan 1, 2016
1.864
+0.192
11.5%
Ranking of countries by current statistics by years


Comments: