29
/
en
AIzaSyAYiBZKx7MnpbEhh9jyipgxe19OcubqV5w
April 1, 2024
213762
Nigeria
NGA
true
2
1
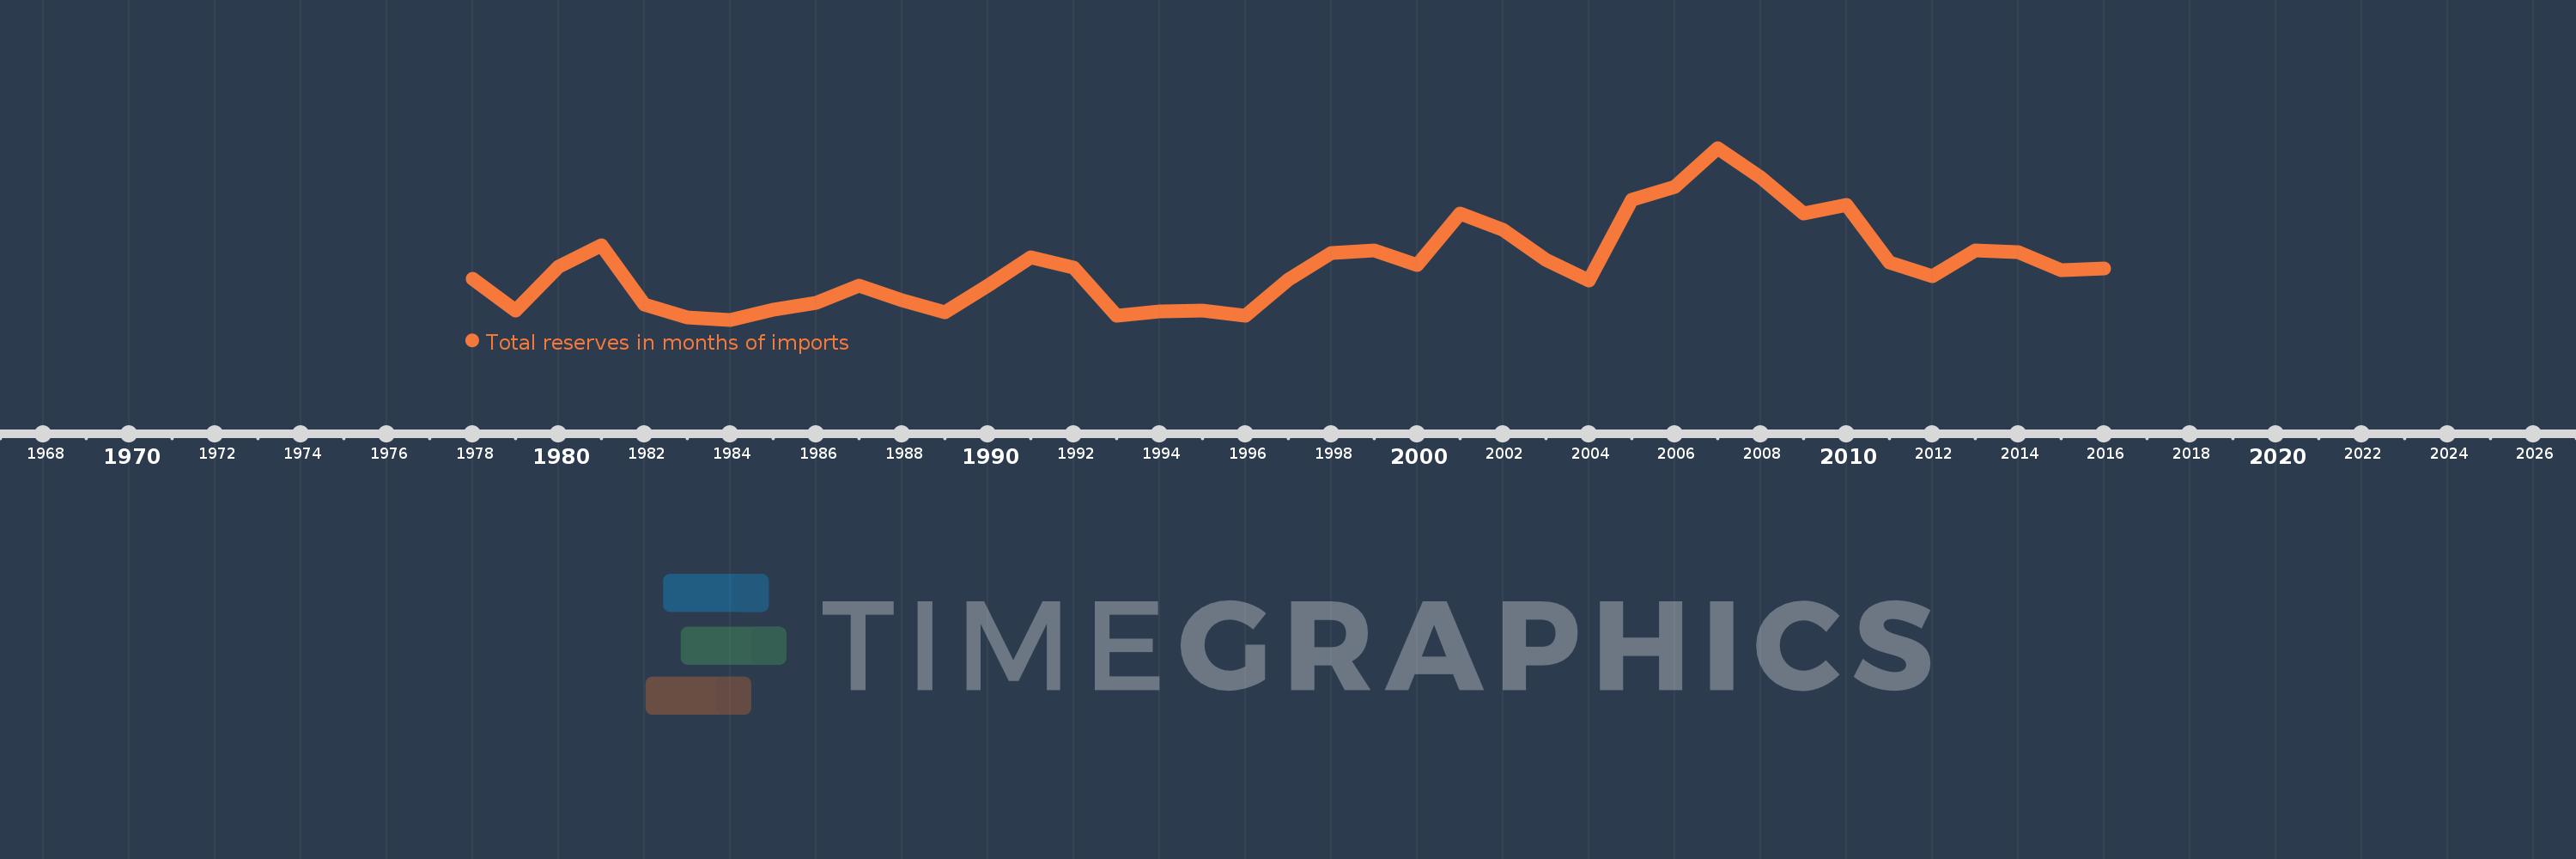
Total reserves in months of imports
2016,2015,2014,2013,2012,2011,2010,2009,2008,2007,2006,2005,2004,2003,2002,2001,2000,1999,1998,1997,1996,1995,1994,1993,1992,1991,1990,1989,1988,1987,1986,1985,1984,1983,1982,1981,1980,1979,1978
This statistics in other country:
AfghanistanAlbaniaAlgeriaAngolaAntigua and BarbudaArab WorldArgentinaArmeniaArubaAustraliaAustriaAzerbaijanBahamas, TheBahrainBangladeshBarbadosBelarusBelgiumBelizeBeninBhutanBoliviaBosnia and HerzegovinaBotswanaBrazilBrunei DarussalamBulgariaBurkina FasoBurundiCabo VerdeCambodiaCameroonCanadaCaribbean small statesCentral African RepublicCentral Europe and the BalticsChadChileChinaColombiaComorosCongo, Dem. Rep.Congo, Rep.Costa RicaCote d'IvoireCroatiaCuracaoCyprusCzech RepublicDenmarkDjiboutiDominicaDominican RepublicEarly-demographic dividendEast Asia & PacificEast Asia & Pacific (excluding high income)East Asia & Pacific (IDA & IBRD countries)EcuadorEgypt, Arab Rep.El SalvadorEquatorial GuineaEritreaEstoniaEthiopiaEuro areaEurope & Central AsiaEurope & Central Asia (excluding high income)Europe & Central Asia (IDA & IBRD countries)European UnionFijiFinlandFragile and conflict affected situationsFranceGabonGambia, TheGeorgiaGermanyGhanaGreeceGrenadaGuatemalaGuineaGuinea-BissauGuyanaHaitiHeavily indebted poor countries (HIPC)High incomeHondurasHong Kong SAR, ChinaHungaryIBRD onlyIcelandIDA & IBRD totalIDA blendIDA onlyIDA totalIndiaIndonesiaIran, Islamic Rep.IraqIrelandIsraelItalyJamaicaJapanJordanKazakhstanKenyaKorea, Rep.KosovoKuwaitKyrgyz RepublicLao PDRLate-demographic dividendLatin America & Caribbean Latin America & Caribbean (excluding high income)Latin America & the Caribbean (IDA & IBRD countries)LatviaLeast developed countries: UN classificationLebanonLesothoLiberiaLibyaLithuaniaLow & middle incomeLow incomeLower middle incomeLuxembourgMacao SAR, ChinaMacedonia, FYRMadagascarMalawiMalaysiaMaldivesMaliMaltaMauritaniaMauritiusMexicoMicronesia, Fed. Sts.Middle East & North AfricaMiddle East & North Africa (excluding high income)Middle East & North Africa (IDA & IBRD countries)Middle incomeMoldovaMongoliaMontenegroMoroccoMozambiqueMyanmarNamibiaNepalNetherlandsNicaraguaNigerNigeriaNorth AmericaNorwayOECD membersOmanOther small statesPacific island small statesPakistanPanamaPapua New GuineaParaguayPeruPhilippinesPolandPortugalPost-demographic dividendPre-demographic dividendQatarRomaniaRussian FederationRwandaSamoaSao Tome and PrincipeSaudi ArabiaSenegalSerbiaSeychellesSierra LeoneSingaporeSlovak RepublicSloveniaSmall statesSolomon IslandsSouth AfricaSouth AsiaSouth Asia (IDA & IBRD)South SudanSpainSri LankaSt. Kitts and NevisSt. LuciaSt. Vincent and the GrenadinesSub-Saharan Africa Sub-Saharan Africa (excluding high income)Sub-Saharan Africa (IDA & IBRD countries)SudanSurinameSwazilandSwedenSwitzerlandSyrian Arab RepublicTajikistanTanzaniaThailandTimor-LesteTogoTongaTrinidad and TobagoTunisiaTurkeyUgandaUkraineUnited KingdomUnited StatesUpper middle incomeUruguayVanuatuVenezuela, RBVietnamWest Bank and GazaWorldYemen, Rep.ZambiaZimbabwe Timeline:
This timeline shows a graph from 1978 to 2016 of Nigeria. No data until 1977. Number of actual observations by date: 39.
Source name:
World Development Indicators
Source organization:
International Monetary Fund, International Financial Statistics and data files.
Categories, topics:
Financial Sector, External Debt
Last updated:
apr 23, 2017
Indicators value changes by year
Maximum:
12.098
jan 1, 2007
At the date of observation
Value
Absolute change
Change from previous value
jan 1, 1978
3.685
+3.685
0.0%
jan 1, 1979
1.613
-2.072
-56.23%
jan 1, 1980
4.434
+2.821
174.91%
jan 1, 1981
5.802
+1.368
30.84%
jan 1, 1982
1.971
-3.832
-66.04%
jan 1, 1983
1.171
-0.799
-40.56%
jan 1, 1984
1.015
-0.156
-13.35%
jan 1, 1985
1.689
+0.674
66.43%
jan 1, 1986
2.132
+0.443
26.23%
jan 1, 1987
3.212
+1.08
50.64%
jan 1, 1988
2.281
-0.931
-28.98%
jan 1, 1989
1.48
-0.801
-35.12%
jan 1, 1990
3.218
+1.737
117.38%
jan 1, 1991
5.026
+1.808
56.21%
jan 1, 1992
4.354
-0.672
-13.37%
jan 1, 1993
1.25
-3.104
-71.3%
jan 1, 1994
1.547
+0.297
23.8%
jan 1, 1995
1.583
+0.035
2.29%
jan 1, 1996
1.296
-0.286
-18.09%
jan 1, 1997
3.607
+2.311
178.24%
jan 1, 1998
5.3
+1.693
46.94%
jan 1, 1999
5.474
+0.173
3.27%
jan 1, 2000
4.556
-0.918
-16.77%
jan 1, 2001
7.879
+3.323
72.94%
jan 1, 2002
6.82
-1.059
-13.44%
jan 1, 2003
4.868
-1.952
-28.61%
jan 1, 2004
3.532
-1.336
-27.45%
jan 1, 2005
8.748
+5.216
147.67%
jan 1, 2006
9.605
+0.857
9.79%
jan 1, 2007
12.098
+2.494
25.96%
jan 1, 2008
10.22
-1.878
-15.52%
jan 1, 2009
7.879
-2.341
-22.9%
jan 1, 2010
8.426
+0.547
6.94%
jan 1, 2011
4.717
-3.709
-44.02%
jan 1, 2012
3.801
-0.916
-19.41%
jan 1, 2013
5.491
+1.689
44.44%
jan 1, 2014
5.386
-0.105
-1.91%
jan 1, 2015
4.23
-1.156
-21.46%
jan 1, 2016
4.303
+0.073
1.72%
Ranking of countries by current statistics by years


Comments: