29
/
en
AIzaSyAYiBZKx7MnpbEhh9jyipgxe19OcubqV5w
April 1, 2024
207537
Nepal
NPL
true
2
1
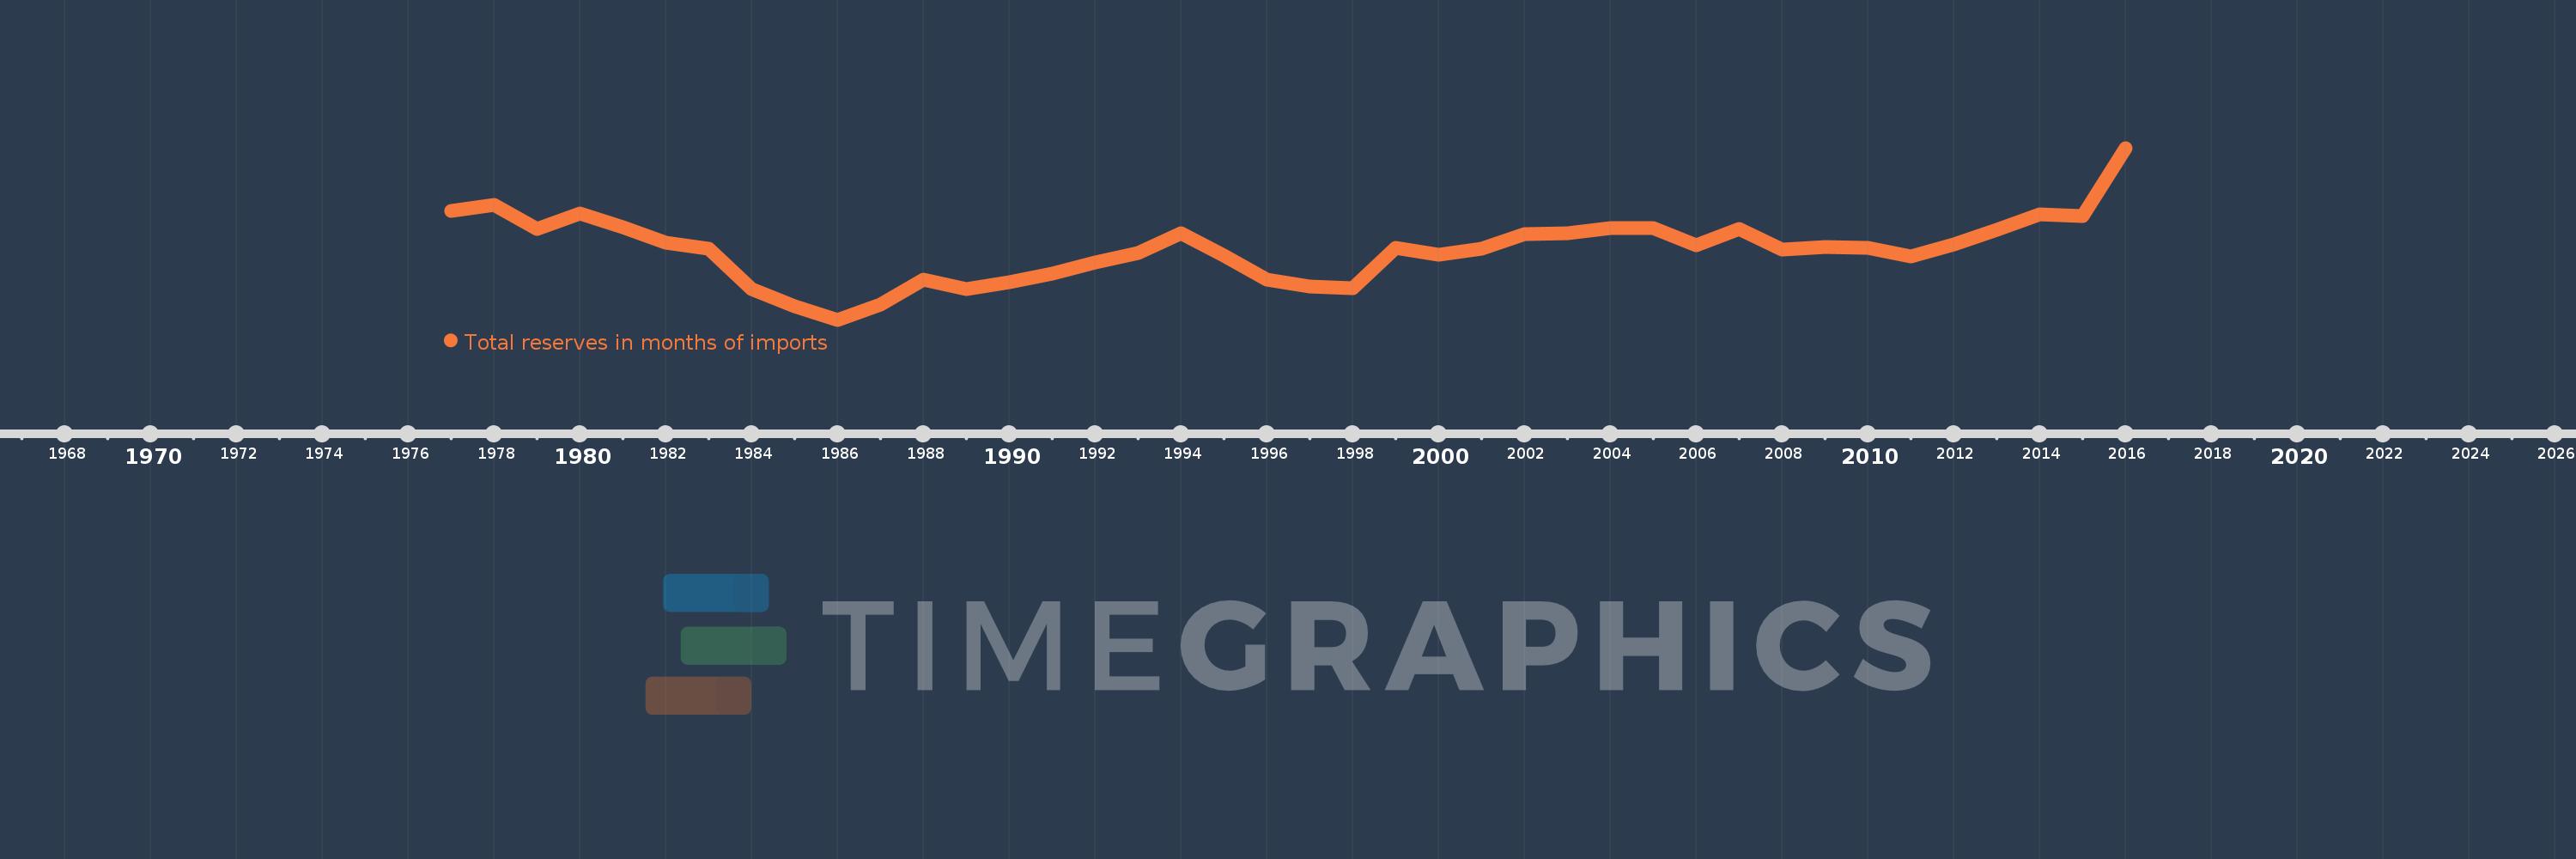
Total reserves in months of imports
2016,2015,2014,2013,2012,2011,2010,2009,2008,2007,2006,2005,2004,2003,2002,2001,2000,1999,1998,1997,1996,1995,1994,1993,1992,1991,1990,1989,1988,1987,1986,1985,1984,1983,1982,1981,1980,1979,1978,1977
This statistics in other country:
AfghanistanAlbaniaAlgeriaAngolaAntigua and BarbudaArab WorldArgentinaArmeniaArubaAustraliaAustriaAzerbaijanBahamas, TheBahrainBangladeshBarbadosBelarusBelgiumBelizeBeninBhutanBoliviaBosnia and HerzegovinaBotswanaBrazilBrunei DarussalamBulgariaBurkina FasoBurundiCabo VerdeCambodiaCameroonCanadaCaribbean small statesCentral African RepublicCentral Europe and the BalticsChadChileChinaColombiaComorosCongo, Dem. Rep.Congo, Rep.Costa RicaCote d'IvoireCroatiaCuracaoCyprusCzech RepublicDenmarkDjiboutiDominicaDominican RepublicEarly-demographic dividendEast Asia & PacificEast Asia & Pacific (excluding high income)East Asia & Pacific (IDA & IBRD countries)EcuadorEgypt, Arab Rep.El SalvadorEquatorial GuineaEritreaEstoniaEthiopiaEuro areaEurope & Central AsiaEurope & Central Asia (excluding high income)Europe & Central Asia (IDA & IBRD countries)European UnionFijiFinlandFragile and conflict affected situationsFranceGabonGambia, TheGeorgiaGermanyGhanaGreeceGrenadaGuatemalaGuineaGuinea-BissauGuyanaHaitiHeavily indebted poor countries (HIPC)High incomeHondurasHong Kong SAR, ChinaHungaryIBRD onlyIcelandIDA & IBRD totalIDA blendIDA onlyIDA totalIndiaIndonesiaIran, Islamic Rep.IraqIrelandIsraelItalyJamaicaJapanJordanKazakhstanKenyaKorea, Rep.KosovoKuwaitKyrgyz RepublicLao PDRLate-demographic dividendLatin America & Caribbean Latin America & Caribbean (excluding high income)Latin America & the Caribbean (IDA & IBRD countries)LatviaLeast developed countries: UN classificationLebanonLesothoLiberiaLibyaLithuaniaLow & middle incomeLow incomeLower middle incomeLuxembourgMacao SAR, ChinaMacedonia, FYRMadagascarMalawiMalaysiaMaldivesMaliMaltaMauritaniaMauritiusMexicoMicronesia, Fed. Sts.Middle East & North AfricaMiddle East & North Africa (excluding high income)Middle East & North Africa (IDA & IBRD countries)Middle incomeMoldovaMongoliaMontenegroMoroccoMozambiqueMyanmarNamibiaNepalNetherlandsNicaraguaNigerNigeriaNorth AmericaNorwayOECD membersOmanOther small statesPacific island small statesPakistanPanamaPapua New GuineaParaguayPeruPhilippinesPolandPortugalPost-demographic dividendPre-demographic dividendQatarRomaniaRussian FederationRwandaSamoaSao Tome and PrincipeSaudi ArabiaSenegalSerbiaSeychellesSierra LeoneSingaporeSlovak RepublicSloveniaSmall statesSolomon IslandsSouth AfricaSouth AsiaSouth Asia (IDA & IBRD)South SudanSpainSri LankaSt. Kitts and NevisSt. LuciaSt. Vincent and the GrenadinesSub-Saharan Africa Sub-Saharan Africa (excluding high income)Sub-Saharan Africa (IDA & IBRD countries)SudanSurinameSwazilandSwedenSwitzerlandSyrian Arab RepublicTajikistanTanzaniaThailandTimor-LesteTogoTongaTrinidad and TobagoTunisiaTurkeyUgandaUkraineUnited KingdomUnited StatesUpper middle incomeUruguayVanuatuVenezuela, RBVietnamWest Bank and GazaWorldYemen, Rep.ZambiaZimbabwe Timeline:
This timeline shows a graph from 1977 to 2016 of Nepal. No data until 1976. Number of actual observations by date: 40.
Source name:
World Development Indicators
Source organization:
International Monetary Fund, International Financial Statistics and data files.
Categories, topics:
Financial Sector, External Debt
Last updated:
apr 23, 2017
Indicators value changes by year
Maximum:
12.534
jan 1, 2016
At the date of observation
Value
Absolute change
Change from previous value
jan 1, 1977
8.767
+8.767
0.0%
jan 1, 1978
9.11
+0.343
3.91%
jan 1, 1979
7.664
-1.446
-15.87%
jan 1, 1980
8.594
+0.93
12.13%
jan 1, 1981
7.796
-0.797
-9.28%
jan 1, 1982
6.844
-0.953
-12.22%
jan 1, 1983
6.522
-0.321
-4.7%
jan 1, 1984
4.104
-2.418
-37.07%
jan 1, 1985
3.042
-1.063
-25.89%
jan 1, 1986
2.245
-0.796
-26.18%
jan 1, 1987
3.161
+0.916
40.78%
jan 1, 1988
4.639
+1.478
46.77%
jan 1, 1989
4.088
-0.551
-11.88%
jan 1, 1990
4.508
+0.419
10.26%
jan 1, 1991
5.028
+0.52
11.53%
jan 1, 1992
5.655
+0.627
12.47%
jan 1, 1993
6.259
+0.604
10.68%
jan 1, 1994
7.405
+1.147
18.32%
jan 1, 1995
6.073
-1.333
-18.0%
jan 1, 1996
4.669
-1.403
-23.11%
jan 1, 1997
4.257
-0.412
-8.83%
jan 1, 1998
4.137
-0.12
-2.82%
jan 1, 1999
6.57
+2.432
58.79%
jan 1, 2000
6.151
-0.418
-6.37%
jan 1, 2001
6.491
+0.34
5.52%
jan 1, 2002
7.367
+0.875
13.48%
jan 1, 2003
7.407
+0.041
0.56%
jan 1, 2004
7.713
+0.306
4.13%
jan 1, 2005
7.739
+0.026
0.33%
jan 1, 2006
6.701
-1.037
-13.41%
jan 1, 2007
7.665
+0.964
14.39%
jan 1, 2008
6.457
-1.208
-15.76%
jan 1, 2009
6.62
+0.162
2.51%
jan 1, 2010
6.565
-0.054
-0.82%
jan 1, 2011
6.011
-0.555
-8.45%
jan 1, 2012
6.745
+0.734
12.21%
jan 1, 2013
7.607
+0.862
12.78%
jan 1, 2014
8.56
+0.953
12.53%
jan 1, 2015
8.435
-0.125
-1.46%
jan 1, 2016
12.534
+4.099
48.59%
Ranking of countries by current statistics by years


Comments: