29
/
en
AIzaSyAYiBZKx7MnpbEhh9jyipgxe19OcubqV5w
April 1, 2024
161081
Israel
ISR
true
2
1
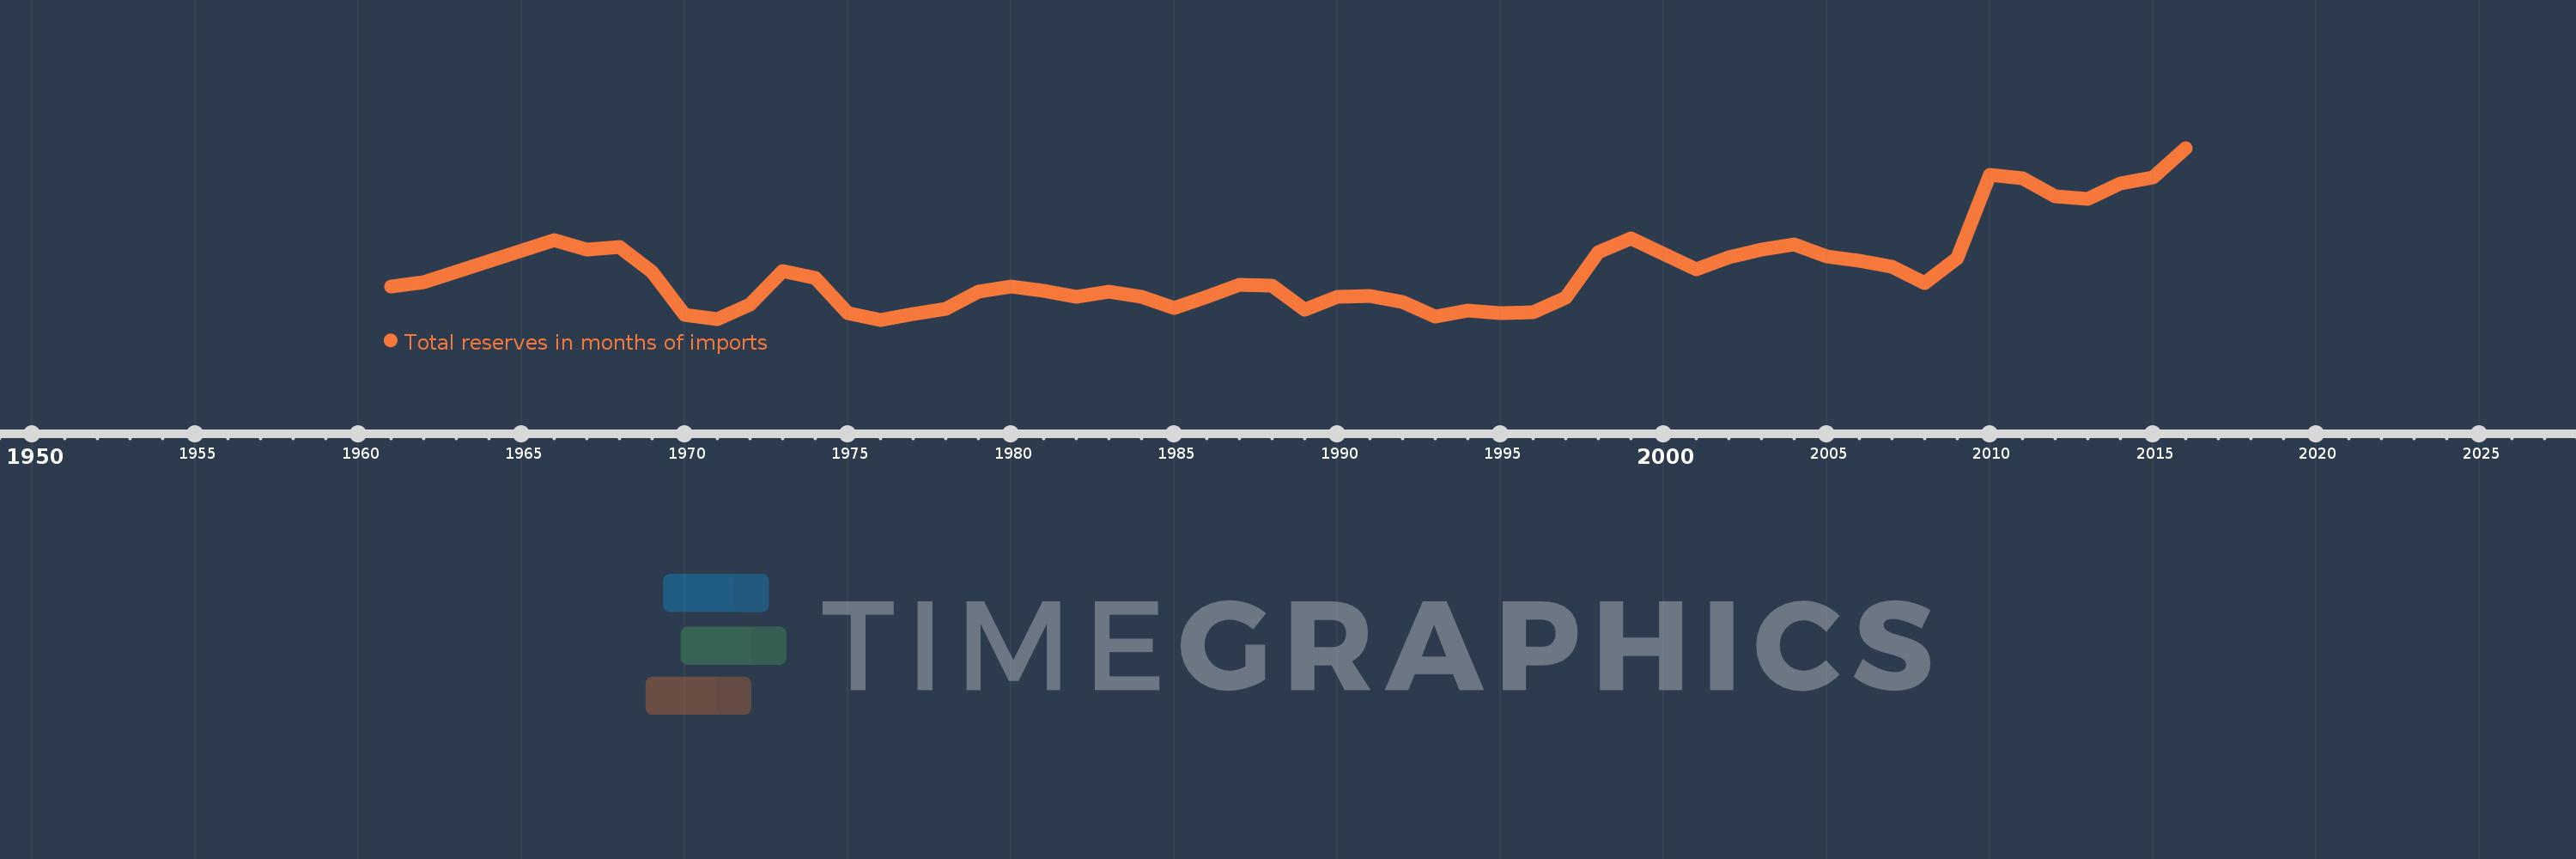
Total reserves in months of imports
2016,2015,2014,2013,2012,2011,2010,2009,2008,2007,2006,2005,2004,2003,2002,2001,2000,1999,1998,1997,1996,1995,1994,1993,1992,1991,1990,1989,1988,1987,1986,1985,1984,1983,1982,1981,1980,1979,1978,1977,1976,1975,1974,1973,1972,1971,1970,1969,1968,1967,1966,1962,1961
This statistics in other country:
AfghanistanAlbaniaAlgeriaAngolaAntigua and BarbudaArab WorldArgentinaArmeniaArubaAustraliaAustriaAzerbaijanBahamas, TheBahrainBangladeshBarbadosBelarusBelgiumBelizeBeninBhutanBoliviaBosnia and HerzegovinaBotswanaBrazilBrunei DarussalamBulgariaBurkina FasoBurundiCabo VerdeCambodiaCameroonCanadaCaribbean small statesCentral African RepublicCentral Europe and the BalticsChadChileChinaColombiaComorosCongo, Dem. Rep.Congo, Rep.Costa RicaCote d'IvoireCroatiaCuracaoCyprusCzech RepublicDenmarkDjiboutiDominicaDominican RepublicEarly-demographic dividendEast Asia & PacificEast Asia & Pacific (excluding high income)East Asia & Pacific (IDA & IBRD countries)EcuadorEgypt, Arab Rep.El SalvadorEquatorial GuineaEritreaEstoniaEthiopiaEuro areaEurope & Central AsiaEurope & Central Asia (excluding high income)Europe & Central Asia (IDA & IBRD countries)European UnionFijiFinlandFragile and conflict affected situationsFranceGabonGambia, TheGeorgiaGermanyGhanaGreeceGrenadaGuatemalaGuineaGuinea-BissauGuyanaHaitiHeavily indebted poor countries (HIPC)High incomeHondurasHong Kong SAR, ChinaHungaryIBRD onlyIcelandIDA & IBRD totalIDA blendIDA onlyIDA totalIndiaIndonesiaIran, Islamic Rep.IraqIrelandIsraelItalyJamaicaJapanJordanKazakhstanKenyaKorea, Rep.KosovoKuwaitKyrgyz RepublicLao PDRLate-demographic dividendLatin America & Caribbean Latin America & Caribbean (excluding high income)Latin America & the Caribbean (IDA & IBRD countries)LatviaLeast developed countries: UN classificationLebanonLesothoLiberiaLibyaLithuaniaLow & middle incomeLow incomeLower middle incomeLuxembourgMacao SAR, ChinaMacedonia, FYRMadagascarMalawiMalaysiaMaldivesMaliMaltaMauritaniaMauritiusMexicoMicronesia, Fed. Sts.Middle East & North AfricaMiddle East & North Africa (excluding high income)Middle East & North Africa (IDA & IBRD countries)Middle incomeMoldovaMongoliaMontenegroMoroccoMozambiqueMyanmarNamibiaNepalNetherlandsNicaraguaNigerNigeriaNorth AmericaNorwayOECD membersOmanOther small statesPacific island small statesPakistanPanamaPapua New GuineaParaguayPeruPhilippinesPolandPortugalPost-demographic dividendPre-demographic dividendQatarRomaniaRussian FederationRwandaSamoaSao Tome and PrincipeSaudi ArabiaSenegalSerbiaSeychellesSierra LeoneSingaporeSlovak RepublicSloveniaSmall statesSolomon IslandsSouth AfricaSouth AsiaSouth Asia (IDA & IBRD)South SudanSpainSri LankaSt. Kitts and NevisSt. LuciaSt. Vincent and the GrenadinesSub-Saharan Africa Sub-Saharan Africa (excluding high income)Sub-Saharan Africa (IDA & IBRD countries)SudanSurinameSwazilandSwedenSwitzerlandSyrian Arab RepublicTajikistanTanzaniaThailandTimor-LesteTogoTongaTrinidad and TobagoTunisiaTurkeyUgandaUkraineUnited KingdomUnited StatesUpper middle incomeUruguayVanuatuVenezuela, RBVietnamWest Bank and GazaWorldYemen, Rep.ZambiaZimbabwe Timeline:
This timeline shows a graph from 1961 to 2016 of Israel. No data until 1960. Number of actual observations by date: 53.
Source name:
World Development Indicators
Source organization:
International Monetary Fund, International Financial Statistics and data files.
Categories, topics:
Financial Sector, External Debt
Last updated:
apr 23, 2017
Indicators value changes by year
Maximum:
11.233
jan 1, 2016
At the date of observation
Value
Absolute change
Change from previous value
jan 1, 1961
3.835
+3.835
0.0%
jan 1, 1962
4.076
+0.241
6.27%
jan 1, 1966
6.316
+2.24
54.97%
jan 1, 1967
5.811
-0.505
-7.99%
jan 1, 1968
5.928
+0.117
2.01%
jan 1, 1969
4.6
-1.328
-22.4%
jan 1, 1970
2.336
-2.264
-49.22%
jan 1, 1971
2.073
-0.263
-11.26%
jan 1, 1972
2.883
+0.81
39.09%
jan 1, 1973
4.671
+1.788
62.01%
jan 1, 1974
4.312
-0.359
-7.68%
jan 1, 1975
2.413
-1.9
-44.05%
jan 1, 1976
2.056
-0.356
-14.77%
jan 1, 1977
2.374
+0.318
15.45%
jan 1, 1978
2.63
+0.256
10.8%
jan 1, 1979
3.571
+0.94
35.75%
jan 1, 1980
3.824
+0.254
7.11%
jan 1, 1981
3.616
-0.208
-5.45%
jan 1, 1982
3.261
-0.355
-9.8%
jan 1, 1983
3.551
+0.289
8.86%
jan 1, 1984
3.271
-0.279
-7.86%
jan 1, 1985
2.68
-0.591
-18.07%
jan 1, 1986
3.269
+0.589
21.97%
jan 1, 1987
3.905
+0.635
19.43%
jan 1, 1988
3.897
-0.008
-0.21%
jan 1, 1989
2.6
-1.297
-33.27%
jan 1, 1990
3.291
+0.691
26.56%
jan 1, 1991
3.327
+0.036
1.1%
jan 1, 1992
3.013
-0.314
-9.43%
jan 1, 1993
2.232
-0.781
-25.93%
jan 1, 1994
2.531
+0.299
13.42%
jan 1, 1995
2.396
-0.135
-5.33%
jan 1, 1996
2.463
+0.066
2.76%
jan 1, 1997
3.213
+0.75
30.46%
jan 1, 1998
5.67
+2.457
76.48%
jan 1, 1999
6.406
+0.736
12.98%
jan 1, 2000
5.569
-0.837
-13.07%
jan 1, 2001
4.755
-0.813
-14.6%
jan 1, 2002
5.405
+0.65
13.67%
jan 1, 2003
5.798
+0.392
7.25%
jan 1, 2004
6.063
+0.266
4.58%
jan 1, 2005
5.423
-0.64
-10.55%
jan 1, 2006
5.196
-0.228
-4.2%
jan 1, 2007
4.885
-0.311
-5.98%
jan 1, 2008
4.032
-0.852
-17.45%
jan 1, 2009
5.332
+1.3
32.24%
jan 1, 2010
9.786
+4.454
83.53%
jan 1, 2011
9.622
-0.164
-1.68%
jan 1, 2012
8.63
-0.992
-10.31%
jan 1, 2013
8.508
-0.122
-1.42%
jan 1, 2014
9.327
+0.819
9.63%
jan 1, 2015
9.661
+0.335
3.59%
jan 1, 2016
11.233
+1.571
16.27%
Ranking of countries by current statistics by years


Comments: