29
/
en
AIzaSyAYiBZKx7MnpbEhh9jyipgxe19OcubqV5w
April 1, 2024
253758
Sudan
SDN
true
2
1
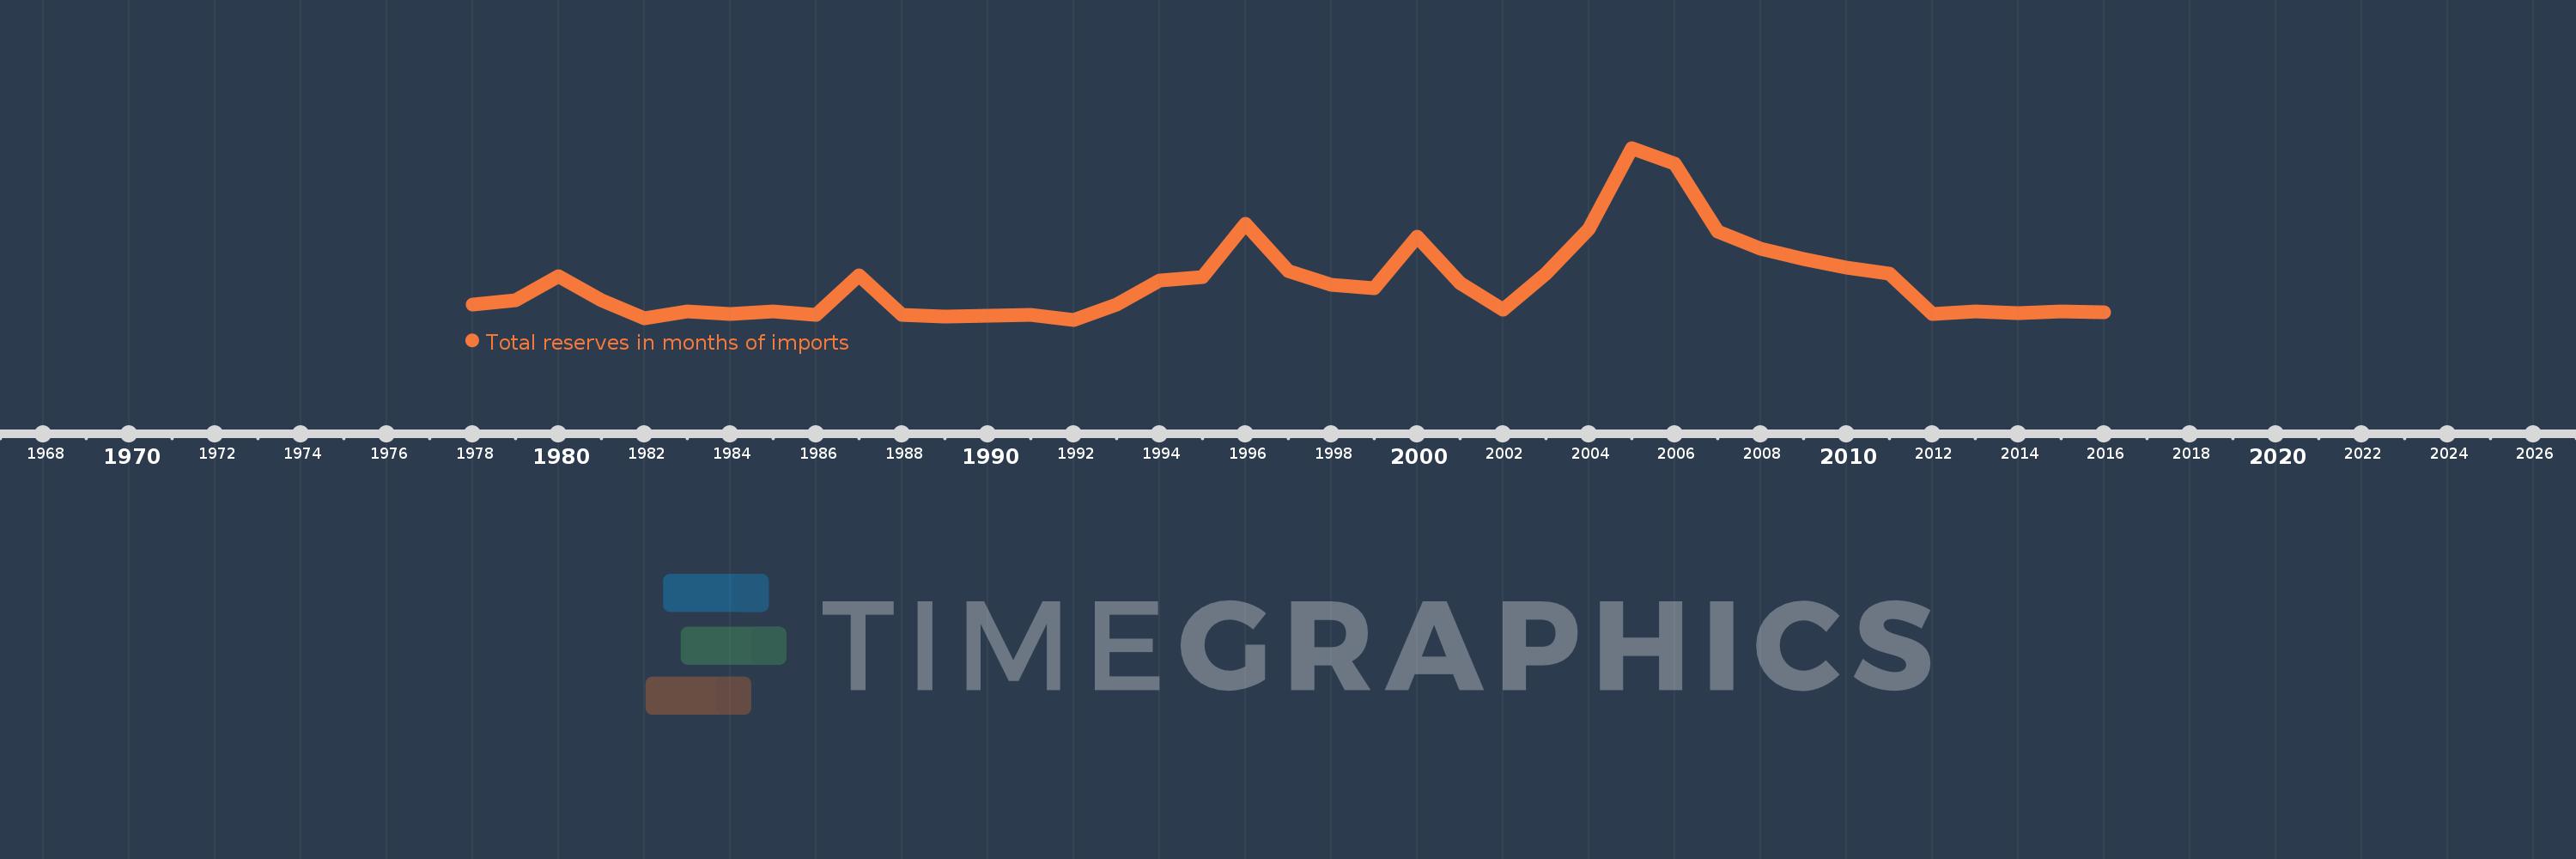
Total reserves in months of imports
2016,2015,2014,2013,2012,2011,2010,2009,2008,2007,2006,2005,2004,2003,2002,2001,2000,1999,1998,1997,1996,1995,1994,1993,1992,1991,1990,1989,1988,1987,1986,1985,1984,1983,1982,1981,1980,1979,1978
This statistics in other country:
AfghanistanAlbaniaAlgeriaAngolaAntigua and BarbudaArab WorldArgentinaArmeniaArubaAustraliaAustriaAzerbaijanBahamas, TheBahrainBangladeshBarbadosBelarusBelgiumBelizeBeninBhutanBoliviaBosnia and HerzegovinaBotswanaBrazilBrunei DarussalamBulgariaBurkina FasoBurundiCabo VerdeCambodiaCameroonCanadaCaribbean small statesCentral African RepublicCentral Europe and the BalticsChadChileChinaColombiaComorosCongo, Dem. Rep.Congo, Rep.Costa RicaCote d'IvoireCroatiaCuracaoCyprusCzech RepublicDenmarkDjiboutiDominicaDominican RepublicEarly-demographic dividendEast Asia & PacificEast Asia & Pacific (excluding high income)East Asia & Pacific (IDA & IBRD countries)EcuadorEgypt, Arab Rep.El SalvadorEquatorial GuineaEritreaEstoniaEthiopiaEuro areaEurope & Central AsiaEurope & Central Asia (excluding high income)Europe & Central Asia (IDA & IBRD countries)European UnionFijiFinlandFragile and conflict affected situationsFranceGabonGambia, TheGeorgiaGermanyGhanaGreeceGrenadaGuatemalaGuineaGuinea-BissauGuyanaHaitiHeavily indebted poor countries (HIPC)High incomeHondurasHong Kong SAR, ChinaHungaryIBRD onlyIcelandIDA & IBRD totalIDA blendIDA onlyIDA totalIndiaIndonesiaIran, Islamic Rep.IraqIrelandIsraelItalyJamaicaJapanJordanKazakhstanKenyaKorea, Rep.KosovoKuwaitKyrgyz RepublicLao PDRLate-demographic dividendLatin America & Caribbean Latin America & Caribbean (excluding high income)Latin America & the Caribbean (IDA & IBRD countries)LatviaLeast developed countries: UN classificationLebanonLesothoLiberiaLibyaLithuaniaLow & middle incomeLow incomeLower middle incomeLuxembourgMacao SAR, ChinaMacedonia, FYRMadagascarMalawiMalaysiaMaldivesMaliMaltaMauritaniaMauritiusMexicoMicronesia, Fed. Sts.Middle East & North AfricaMiddle East & North Africa (excluding high income)Middle East & North Africa (IDA & IBRD countries)Middle incomeMoldovaMongoliaMontenegroMoroccoMozambiqueMyanmarNamibiaNepalNetherlandsNicaraguaNigerNigeriaNorth AmericaNorwayOECD membersOmanOther small statesPacific island small statesPakistanPanamaPapua New GuineaParaguayPeruPhilippinesPolandPortugalPost-demographic dividendPre-demographic dividendQatarRomaniaRussian FederationRwandaSamoaSao Tome and PrincipeSaudi ArabiaSenegalSerbiaSeychellesSierra LeoneSingaporeSlovak RepublicSloveniaSmall statesSolomon IslandsSouth AfricaSouth AsiaSouth Asia (IDA & IBRD)South SudanSpainSri LankaSt. Kitts and NevisSt. LuciaSt. Vincent and the GrenadinesSub-Saharan Africa Sub-Saharan Africa (excluding high income)Sub-Saharan Africa (IDA & IBRD countries)SudanSurinameSwazilandSwedenSwitzerlandSyrian Arab RepublicTajikistanTanzaniaThailandTimor-LesteTogoTongaTrinidad and TobagoTunisiaTurkeyUgandaUkraineUnited KingdomUnited StatesUpper middle incomeUruguayVanuatuVenezuela, RBVietnamWest Bank and GazaWorldYemen, Rep.ZambiaZimbabwe Timeline:
This timeline shows a graph from 1978 to 2016 of Sudan. No data until 1977. Number of actual observations by date: 39.
Source name:
World Development Indicators
Source organization:
International Monetary Fund, International Financial Statistics and data files.
Categories, topics:
Financial Sector, External Debt
Last updated:
apr 23, 2017
Indicators value changes by year
At the date of observation
Value
Absolute change
Change from previous value
jan 1, 1978
0.298
+0.298
0.0%
jan 1, 1979
0.366
+0.068
22.8%
jan 1, 1980
0.746
+0.38
103.65%
jan 1, 1981
0.371
-0.375
-50.29%
jan 1, 1982
0.091
-0.28
-75.56%
jan 1, 1983
0.193
+0.103
113.27%
jan 1, 1984
0.156
-0.037
-19.36%
jan 1, 1985
0.197
+0.041
26.33%
jan 1, 1986
0.141
-0.056
-28.46%
jan 1, 1987
0.767
+0.626
444.33%
jan 1, 1988
0.138
-0.629
-82.0%
jan 1, 1989
0.113
-0.025
-18.4%
jan 1, 1990
0.123
+0.011
9.56%
jan 1, 1991
0.134
+0.01
8.25%
jan 1, 1992
0.062
-0.071
-53.32%
jan 1, 1993
0.298
+0.236
377.84%
jan 1, 1994
0.677
+0.379
127.09%
jan 1, 1995
0.73
+0.053
7.81%
jan 1, 1996
1.577
+0.847
116.05%
jan 1, 1997
0.832
-0.745
-47.26%
jan 1, 1998
0.612
-0.22
-26.42%
jan 1, 1999
0.559
-0.053
-8.71%
jan 1, 2000
1.369
+0.811
145.12%
jan 1, 2001
0.638
-0.732
-53.43%
jan 1, 2002
0.227
-0.41
-64.37%
jan 1, 2003
0.797
+0.569
250.67%
jan 1, 2004
1.496
+0.7
87.86%
jan 1, 2005
2.775
+1.279
85.46%
jan 1, 2006
2.52
-0.256
-9.21%
jan 1, 2007
1.45
-1.07
-42.47%
jan 1, 2008
1.185
-0.264
-18.24%
jan 1, 2009
1.025
-0.161
-13.55%
jan 1, 2010
0.89
-0.135
-13.18%
jan 1, 2011
0.793
-0.096
-10.83%
jan 1, 2012
0.156
-0.637
-80.35%
jan 1, 2013
0.188
+0.033
20.86%
jan 1, 2014
0.171
-0.018
-9.41%
jan 1, 2015
0.195
+0.024
14.25%
jan 1, 2016
0.174
-0.021
-11.0%
Ranking of countries by current statistics by years


Comments: