29
/
en
AIzaSyAYiBZKx7MnpbEhh9jyipgxe19OcubqV5w
April 1, 2024
266413
Tonga
TON
true
2
1
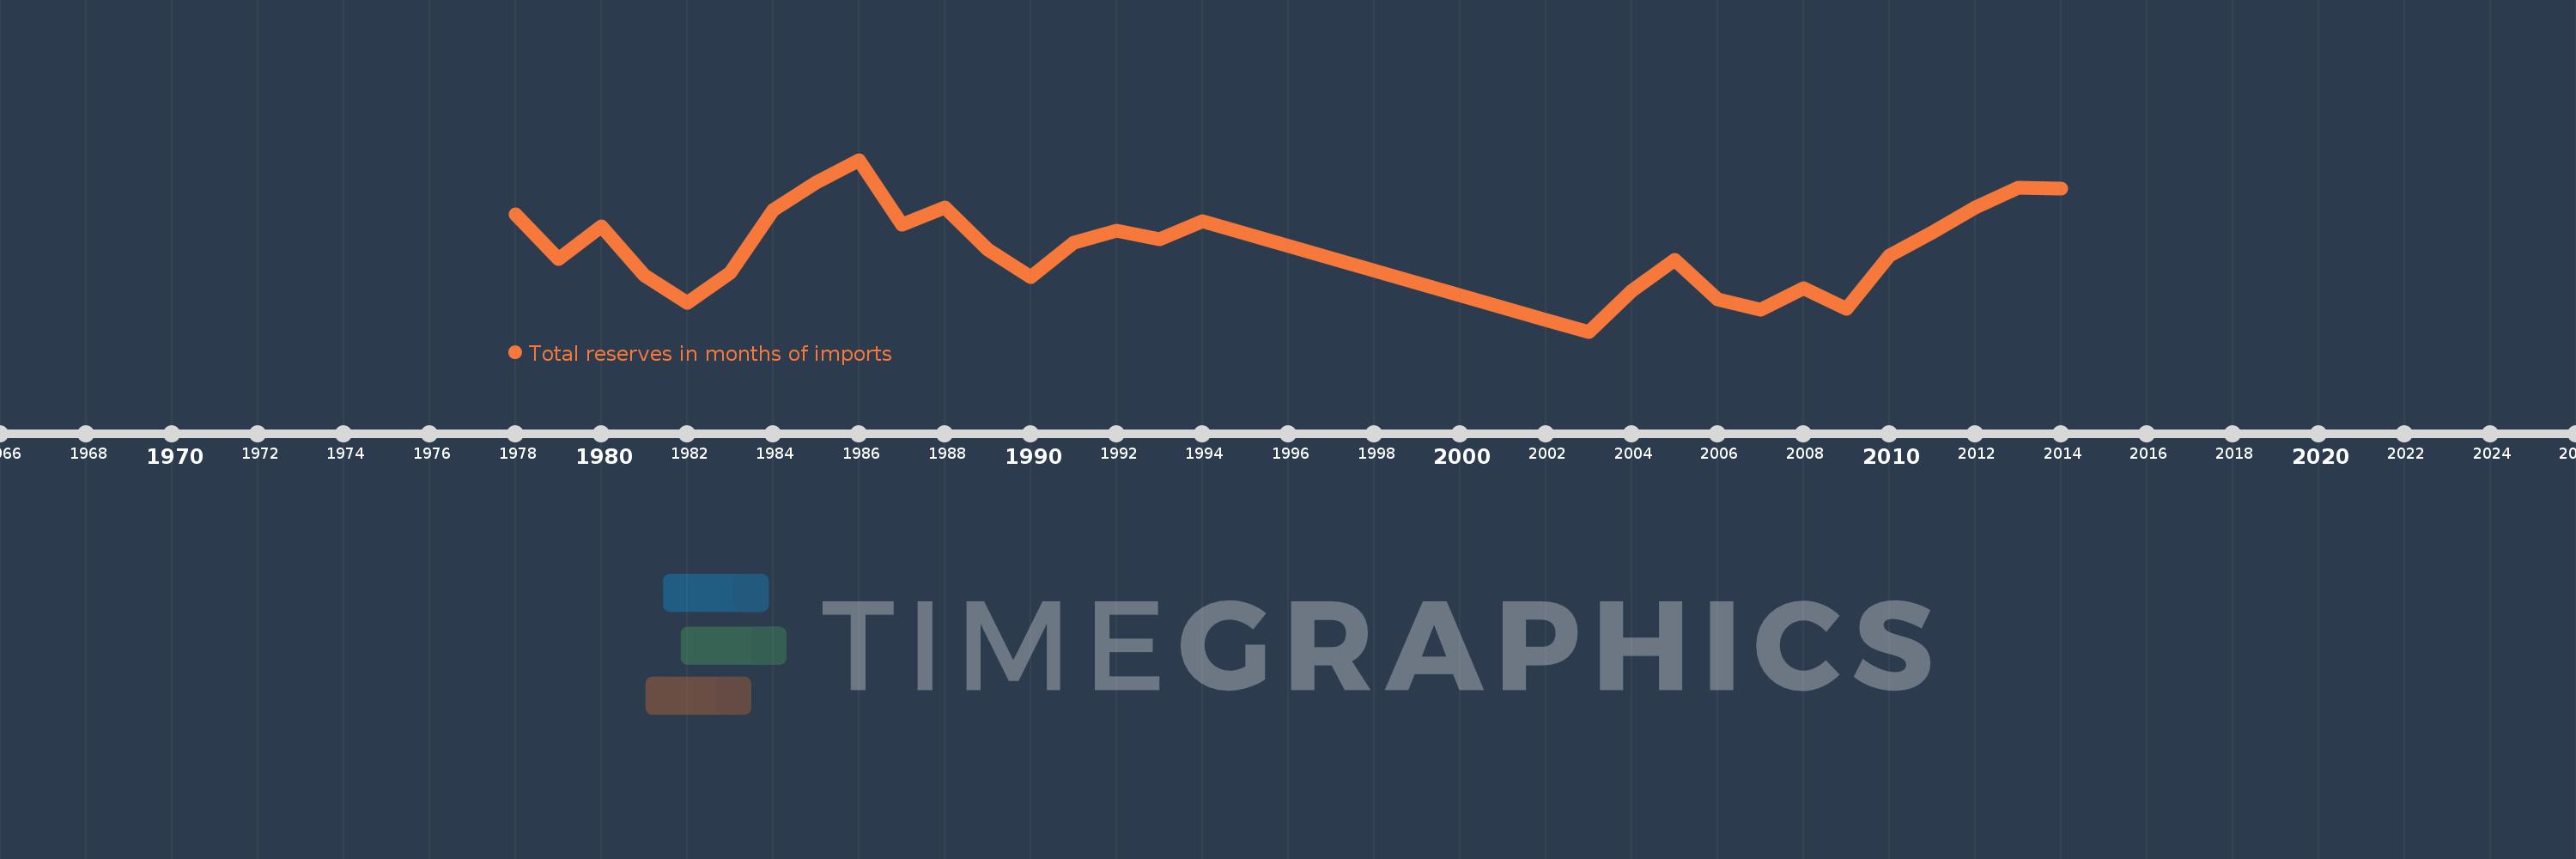
Total reserves in months of imports
2014,2013,2012,2011,2010,2009,2008,2007,2006,2005,2004,2003,2002,1994,1993,1992,1991,1990,1989,1988,1987,1986,1985,1984,1983,1982,1981,1980,1979,1978
This statistics in other country:
AfghanistanAlbaniaAlgeriaAngolaAntigua and BarbudaArab WorldArgentinaArmeniaArubaAustraliaAustriaAzerbaijanBahamas, TheBahrainBangladeshBarbadosBelarusBelgiumBelizeBeninBhutanBoliviaBosnia and HerzegovinaBotswanaBrazilBrunei DarussalamBulgariaBurkina FasoBurundiCabo VerdeCambodiaCameroonCanadaCaribbean small statesCentral African RepublicCentral Europe and the BalticsChadChileChinaColombiaComorosCongo, Dem. Rep.Congo, Rep.Costa RicaCote d'IvoireCroatiaCuracaoCyprusCzech RepublicDenmarkDjiboutiDominicaDominican RepublicEarly-demographic dividendEast Asia & PacificEast Asia & Pacific (excluding high income)East Asia & Pacific (IDA & IBRD countries)EcuadorEgypt, Arab Rep.El SalvadorEquatorial GuineaEritreaEstoniaEthiopiaEuro areaEurope & Central AsiaEurope & Central Asia (excluding high income)Europe & Central Asia (IDA & IBRD countries)European UnionFijiFinlandFragile and conflict affected situationsFranceGabonGambia, TheGeorgiaGermanyGhanaGreeceGrenadaGuatemalaGuineaGuinea-BissauGuyanaHaitiHeavily indebted poor countries (HIPC)High incomeHondurasHong Kong SAR, ChinaHungaryIBRD onlyIcelandIDA & IBRD totalIDA blendIDA onlyIDA totalIndiaIndonesiaIran, Islamic Rep.IraqIrelandIsraelItalyJamaicaJapanJordanKazakhstanKenyaKorea, Rep.KosovoKuwaitKyrgyz RepublicLao PDRLate-demographic dividendLatin America & Caribbean Latin America & Caribbean (excluding high income)Latin America & the Caribbean (IDA & IBRD countries)LatviaLeast developed countries: UN classificationLebanonLesothoLiberiaLibyaLithuaniaLow & middle incomeLow incomeLower middle incomeLuxembourgMacao SAR, ChinaMacedonia, FYRMadagascarMalawiMalaysiaMaldivesMaliMaltaMauritaniaMauritiusMexicoMicronesia, Fed. Sts.Middle East & North AfricaMiddle East & North Africa (excluding high income)Middle East & North Africa (IDA & IBRD countries)Middle incomeMoldovaMongoliaMontenegroMoroccoMozambiqueMyanmarNamibiaNepalNetherlandsNicaraguaNigerNigeriaNorth AmericaNorwayOECD membersOmanOther small statesPacific island small statesPakistanPanamaPapua New GuineaParaguayPeruPhilippinesPolandPortugalPost-demographic dividendPre-demographic dividendQatarRomaniaRussian FederationRwandaSamoaSao Tome and PrincipeSaudi ArabiaSenegalSerbiaSeychellesSierra LeoneSingaporeSlovak RepublicSloveniaSmall statesSolomon IslandsSouth AfricaSouth AsiaSouth Asia (IDA & IBRD)South SudanSpainSri LankaSt. Kitts and NevisSt. LuciaSt. Vincent and the GrenadinesSub-Saharan Africa Sub-Saharan Africa (excluding high income)Sub-Saharan Africa (IDA & IBRD countries)SudanSurinameSwazilandSwedenSwitzerlandSyrian Arab RepublicTajikistanTanzaniaThailandTimor-LesteTogoTongaTrinidad and TobagoTunisiaTurkeyUgandaUkraineUnited KingdomUnited StatesUpper middle incomeUruguayVanuatuVenezuela, RBVietnamWest Bank and GazaWorldYemen, Rep.ZambiaZimbabwe Timeline:
This timeline shows a graph from 1978 to 2014 of Tonga. No data until 1977. Number of actual observations by date: 30.
Source name:
World Development Indicators
Source organization:
International Monetary Fund, International Financial Statistics and data files.
Categories, topics:
Financial Sector, External Debt
Last updated:
apr 23, 2017
Indicators value changes by year
At the date of observation
Value
Absolute change
Change from previous value
jan 1, 1978
5.732
+5.732
0.0%
jan 1, 1979
4.586
-1.146
-19.99%
jan 1, 1980
5.411
+0.825
18.0%
jan 1, 1981
4.173
-1.238
-22.88%
jan 1, 1982
3.486
-0.687
-16.47%
jan 1, 1983
4.244
+0.758
21.74%
jan 1, 1984
5.825
+1.581
37.25%
jan 1, 1985
6.517
+0.692
11.88%
jan 1, 1986
7.1
+0.583
8.95%
jan 1, 1987
5.47
-1.631
-22.96%
jan 1, 1988
5.888
+0.419
7.65%
jan 1, 1989
4.843
-1.045
-17.75%
jan 1, 1990
4.145
-0.697
-14.4%
jan 1, 1991
5.012
+0.867
20.9%
jan 1, 1992
5.31
+0.298
5.95%
jan 1, 1993
5.1
-0.21
-3.96%
jan 1, 1994
5.55
+0.45
8.83%
jan 1, 2002
3.049
-2.501
-45.06%
jan 1, 2003
2.763
-0.286
-9.38%
jan 1, 2004
3.794
+1.031
37.3%
jan 1, 2005
4.582
+0.789
20.79%
jan 1, 2006
3.586
-0.996
-21.74%
jan 1, 2007
3.31
-0.276
-7.7%
jan 1, 2008
3.853
+0.543
16.4%
jan 1, 2009
3.332
-0.521
-13.52%
jan 1, 2010
4.679
+1.347
40.43%
jan 1, 2011
5.264
+0.585
12.49%
jan 1, 2012
5.902
+0.638
12.12%
jan 1, 2013
6.395
+0.493
8.36%
jan 1, 2014
6.368
-0.027
-0.43%
Ranking of countries by current statistics by years


Comments: