29
/
en
AIzaSyAYiBZKx7MnpbEhh9jyipgxe19OcubqV5w
April 1, 2024
132752
Fiji
FJI
true
2
1
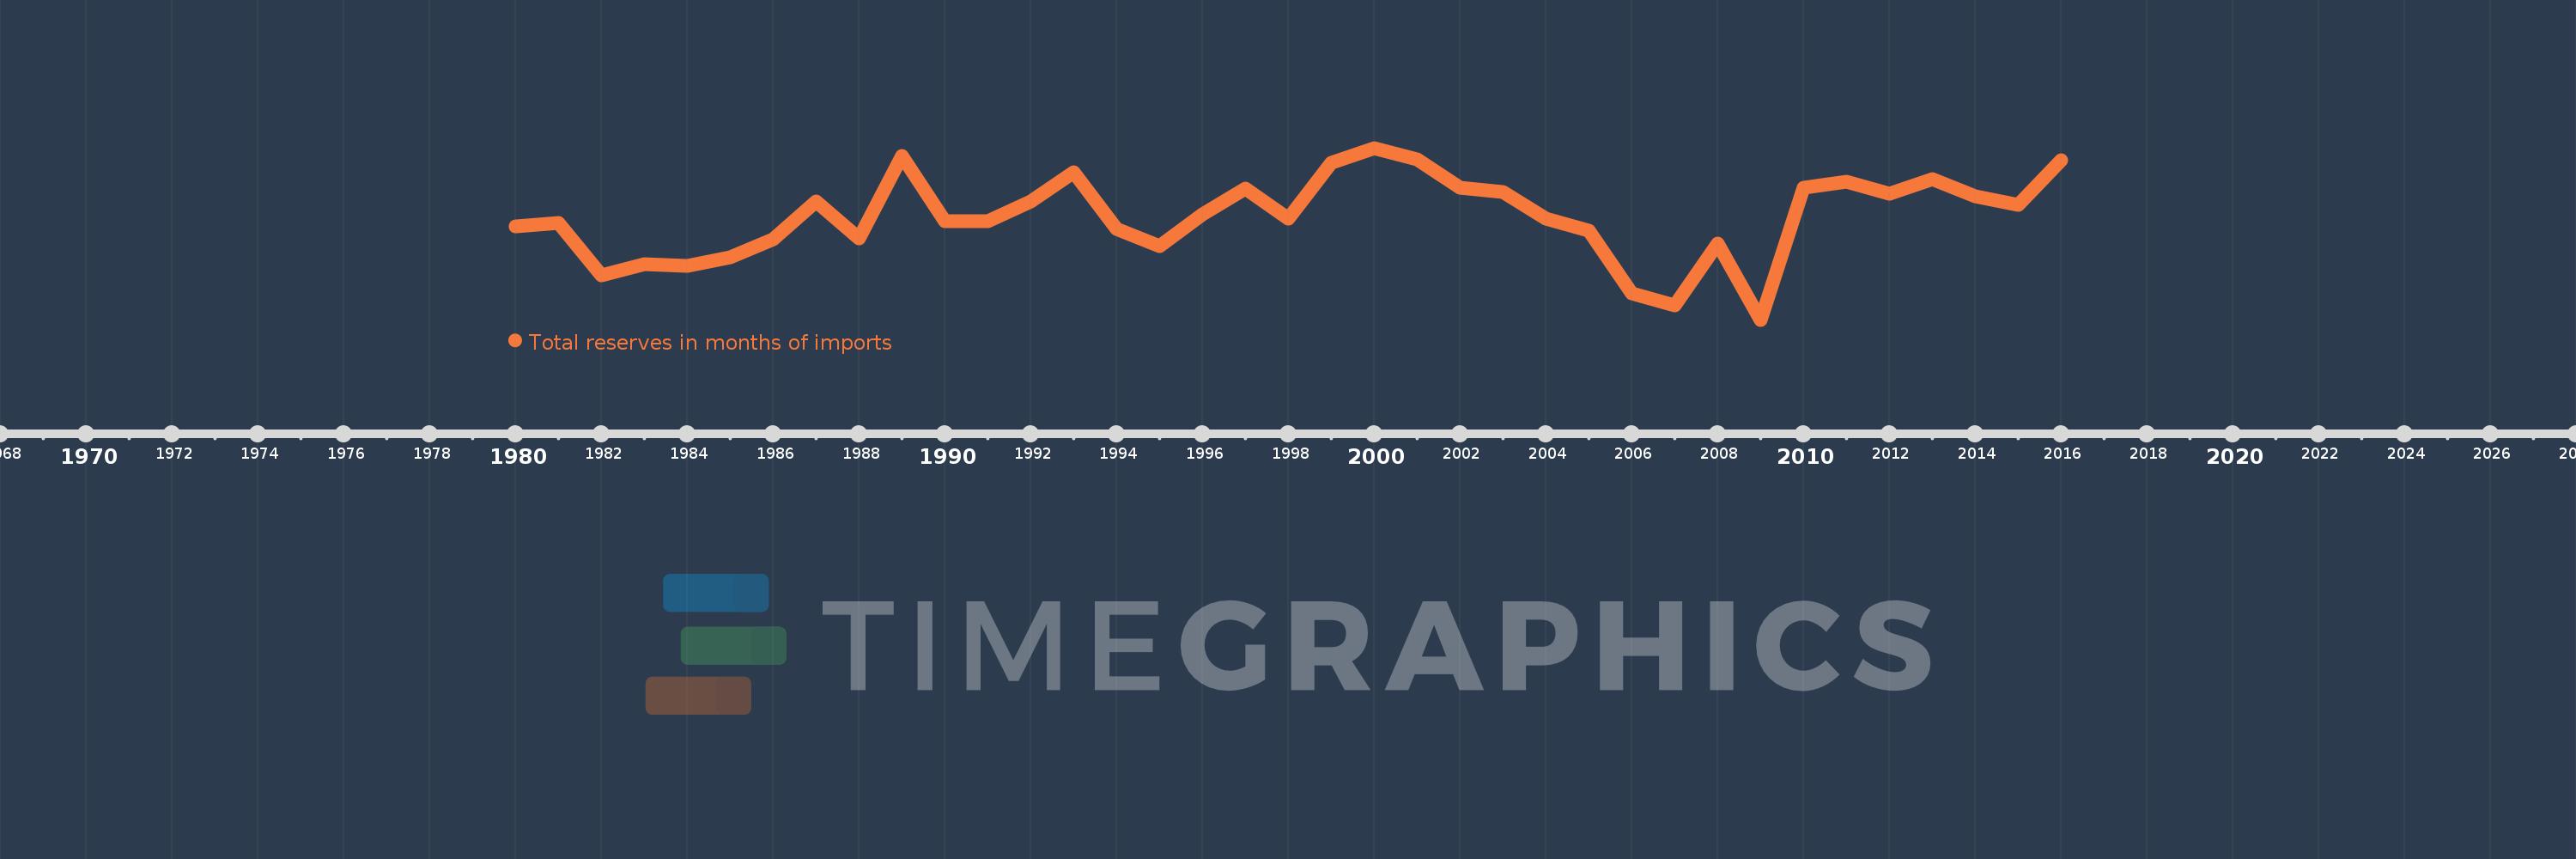
Total reserves in months of imports
2016,2015,2014,2013,2012,2011,2010,2009,2008,2007,2006,2005,2004,2003,2002,2001,2000,1999,1998,1997,1996,1995,1994,1993,1992,1991,1990,1989,1988,1987,1986,1985,1984,1983,1982,1981,1980
This statistics in other country:
AfghanistanAlbaniaAlgeriaAngolaAntigua and BarbudaArab WorldArgentinaArmeniaArubaAustraliaAustriaAzerbaijanBahamas, TheBahrainBangladeshBarbadosBelarusBelgiumBelizeBeninBhutanBoliviaBosnia and HerzegovinaBotswanaBrazilBrunei DarussalamBulgariaBurkina FasoBurundiCabo VerdeCambodiaCameroonCanadaCaribbean small statesCentral African RepublicCentral Europe and the BalticsChadChileChinaColombiaComorosCongo, Dem. Rep.Congo, Rep.Costa RicaCote d'IvoireCroatiaCuracaoCyprusCzech RepublicDenmarkDjiboutiDominicaDominican RepublicEarly-demographic dividendEast Asia & PacificEast Asia & Pacific (excluding high income)East Asia & Pacific (IDA & IBRD countries)EcuadorEgypt, Arab Rep.El SalvadorEquatorial GuineaEritreaEstoniaEthiopiaEuro areaEurope & Central AsiaEurope & Central Asia (excluding high income)Europe & Central Asia (IDA & IBRD countries)European UnionFijiFinlandFragile and conflict affected situationsFranceGabonGambia, TheGeorgiaGermanyGhanaGreeceGrenadaGuatemalaGuineaGuinea-BissauGuyanaHaitiHeavily indebted poor countries (HIPC)High incomeHondurasHong Kong SAR, ChinaHungaryIBRD onlyIcelandIDA & IBRD totalIDA blendIDA onlyIDA totalIndiaIndonesiaIran, Islamic Rep.IraqIrelandIsraelItalyJamaicaJapanJordanKazakhstanKenyaKorea, Rep.KosovoKuwaitKyrgyz RepublicLao PDRLate-demographic dividendLatin America & Caribbean Latin America & Caribbean (excluding high income)Latin America & the Caribbean (IDA & IBRD countries)LatviaLeast developed countries: UN classificationLebanonLesothoLiberiaLibyaLithuaniaLow & middle incomeLow incomeLower middle incomeLuxembourgMacao SAR, ChinaMacedonia, FYRMadagascarMalawiMalaysiaMaldivesMaliMaltaMauritaniaMauritiusMexicoMicronesia, Fed. Sts.Middle East & North AfricaMiddle East & North Africa (excluding high income)Middle East & North Africa (IDA & IBRD countries)Middle incomeMoldovaMongoliaMontenegroMoroccoMozambiqueMyanmarNamibiaNepalNetherlandsNicaraguaNigerNigeriaNorth AmericaNorwayOECD membersOmanOther small statesPacific island small statesPakistanPanamaPapua New GuineaParaguayPeruPhilippinesPolandPortugalPost-demographic dividendPre-demographic dividendQatarRomaniaRussian FederationRwandaSamoaSao Tome and PrincipeSaudi ArabiaSenegalSerbiaSeychellesSierra LeoneSingaporeSlovak RepublicSloveniaSmall statesSolomon IslandsSouth AfricaSouth AsiaSouth Asia (IDA & IBRD)South SudanSpainSri LankaSt. Kitts and NevisSt. LuciaSt. Vincent and the GrenadinesSub-Saharan Africa Sub-Saharan Africa (excluding high income)Sub-Saharan Africa (IDA & IBRD countries)SudanSurinameSwazilandSwedenSwitzerlandSyrian Arab RepublicTajikistanTanzaniaThailandTimor-LesteTogoTongaTrinidad and TobagoTunisiaTurkeyUgandaUkraineUnited KingdomUnited StatesUpper middle incomeUruguayVanuatuVenezuela, RBVietnamWest Bank and GazaWorldYemen, Rep.ZambiaZimbabwe Timeline:
This timeline shows a graph from 1980 to 2016 of Fiji. No data until 1979. Number of actual observations by date: 37.
Source name:
World Development Indicators
Source organization:
International Monetary Fund, International Financial Statistics and data files.
Categories, topics:
Financial Sector, External Debt
Last updated:
apr 23, 2017
Indicators value changes by year
At the date of observation
Value
Absolute change
Change from previous value
jan 1, 1980
3.12
+3.12
0.0%
jan 1, 1981
3.181
+0.061
1.96%
jan 1, 1982
2.219
-0.962
-30.25%
jan 1, 1983
2.421
+0.202
9.1%
jan 1, 1984
2.398
-0.023
-0.94%
jan 1, 1985
2.552
+0.155
6.44%
jan 1, 1986
2.89
+0.338
13.23%
jan 1, 1987
3.59
+0.7
24.22%
jan 1, 1988
2.904
-0.686
-19.11%
jan 1, 1989
4.424
+1.52
52.34%
jan 1, 1990
3.215
-1.209
-27.33%
jan 1, 1991
3.216
+0.001
0.04%
jan 1, 1992
3.579
+0.363
11.3%
jan 1, 1993
4.127
+0.547
15.29%
jan 1, 1994
3.07
-1.056
-25.59%
jan 1, 1995
2.754
-0.316
-10.3%
jan 1, 1996
3.341
+0.587
21.31%
jan 1, 1997
3.816
+0.475
14.22%
jan 1, 1998
3.268
-0.548
-14.36%
jan 1, 1999
4.299
+1.031
31.54%
jan 1, 2000
4.571
+0.272
6.33%
jan 1, 2001
4.357
-0.214
-4.69%
jan 1, 2002
3.837
-0.52
-11.93%
jan 1, 2003
3.759
-0.078
-2.03%
jan 1, 2004
3.27
-0.489
-13.01%
jan 1, 2005
3.04
-0.231
-7.05%
jan 1, 2006
1.891
-1.148
-37.78%
jan 1, 2007
1.658
-0.234
-12.36%
jan 1, 2008
2.811
+1.154
69.61%
jan 1, 2009
1.398
-1.413
-50.26%
jan 1, 2010
3.831
+2.433
173.97%
jan 1, 2011
3.955
+0.123
3.22%
jan 1, 2012
3.733
-0.222
-5.61%
jan 1, 2013
3.989
+0.257
6.87%
jan 1, 2014
3.673
-0.317
-7.94%
jan 1, 2015
3.518
-0.154
-4.2%
jan 1, 2016
4.341
+0.823
23.38%
Ranking of countries by current statistics by years


Comments: