29
/
en
AIzaSyAYiBZKx7MnpbEhh9jyipgxe19OcubqV5w
April 1, 2024
276254
United Kingdom
GBR
true
2
1
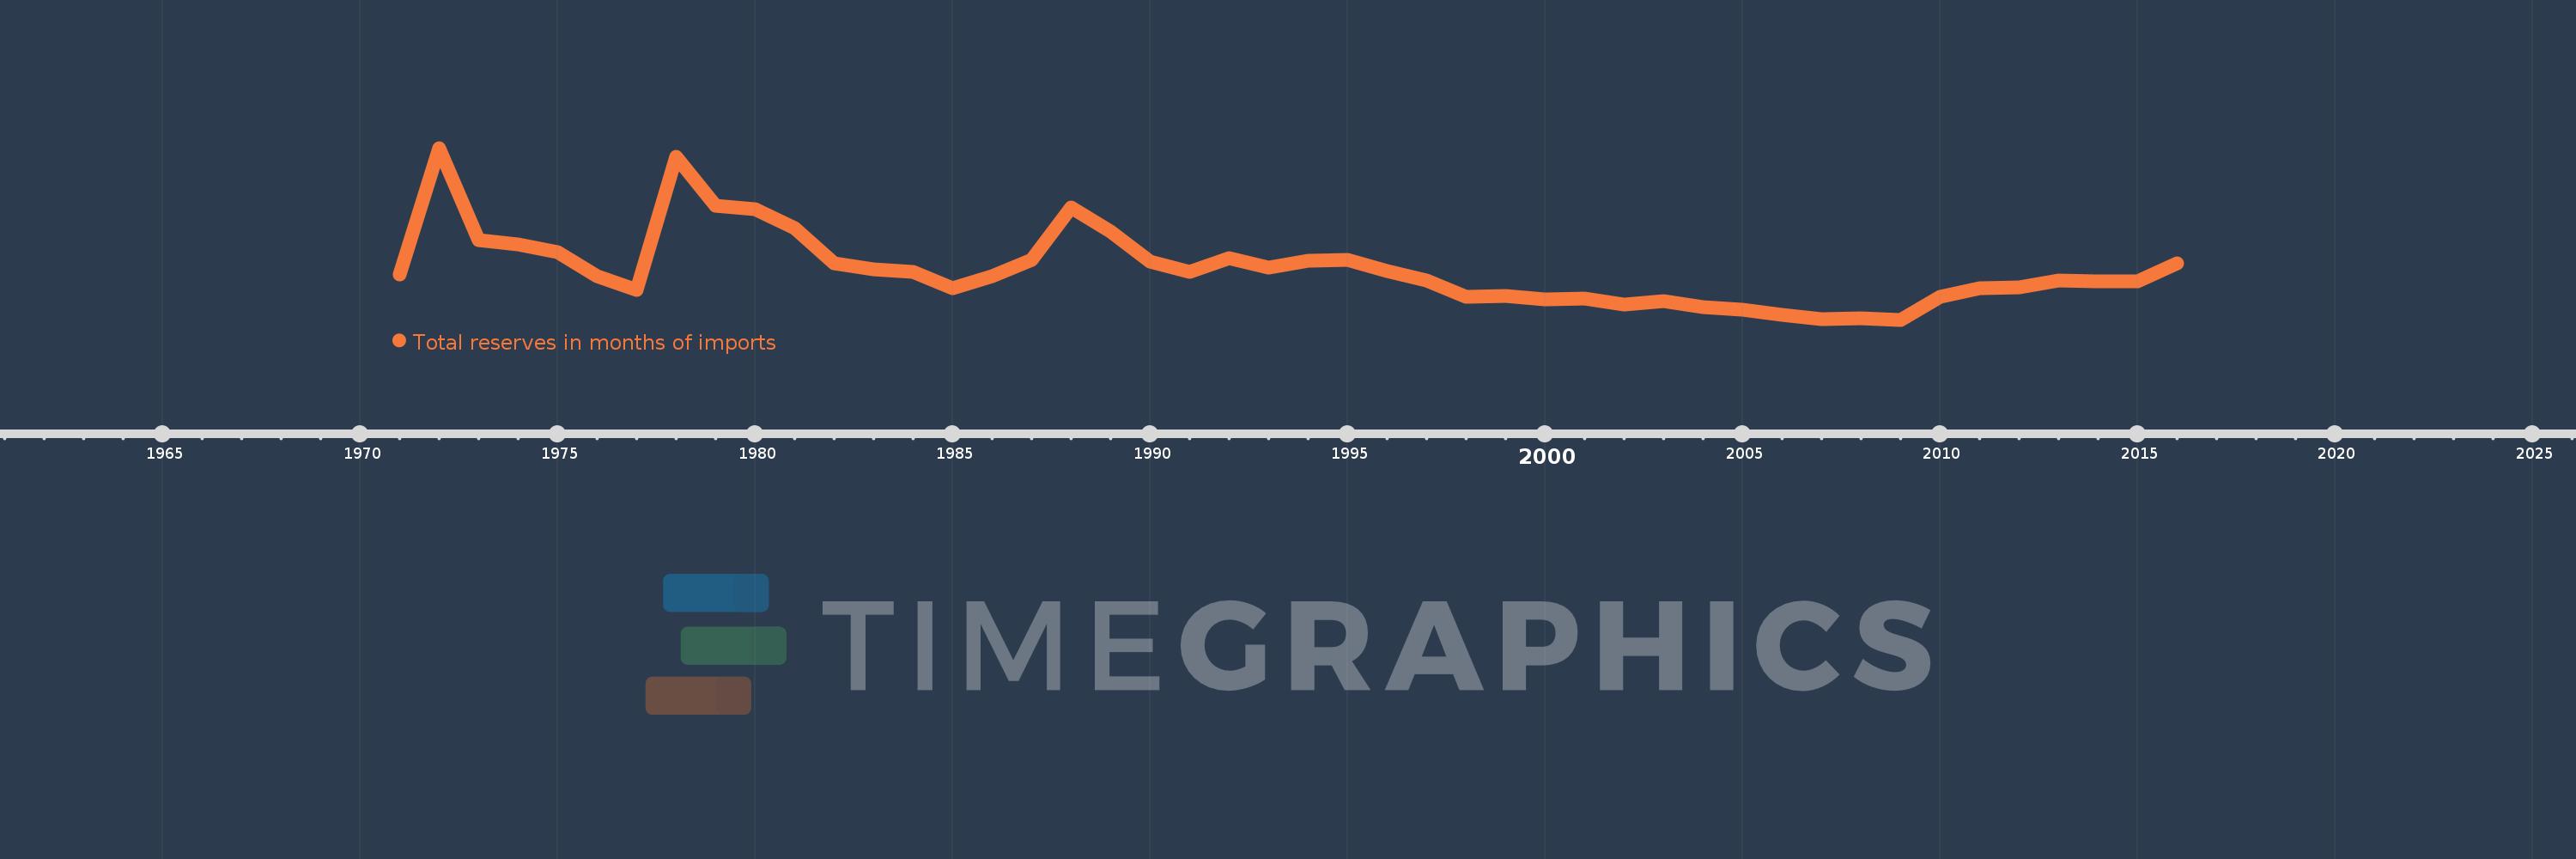
Total reserves in months of imports
2016,2015,2014,2013,2012,2011,2010,2009,2008,2007,2006,2005,2004,2003,2002,2001,2000,1999,1998,1997,1996,1995,1994,1993,1992,1991,1990,1989,1988,1987,1986,1985,1984,1983,1982,1981,1980,1979,1978,1977,1976,1975,1974,1973,1972,1971
This statistics in other country:
AfghanistanAlbaniaAlgeriaAngolaAntigua and BarbudaArab WorldArgentinaArmeniaArubaAustraliaAustriaAzerbaijanBahamas, TheBahrainBangladeshBarbadosBelarusBelgiumBelizeBeninBhutanBoliviaBosnia and HerzegovinaBotswanaBrazilBrunei DarussalamBulgariaBurkina FasoBurundiCabo VerdeCambodiaCameroonCanadaCaribbean small statesCentral African RepublicCentral Europe and the BalticsChadChileChinaColombiaComorosCongo, Dem. Rep.Congo, Rep.Costa RicaCote d'IvoireCroatiaCuracaoCyprusCzech RepublicDenmarkDjiboutiDominicaDominican RepublicEarly-demographic dividendEast Asia & PacificEast Asia & Pacific (excluding high income)East Asia & Pacific (IDA & IBRD countries)EcuadorEgypt, Arab Rep.El SalvadorEquatorial GuineaEritreaEstoniaEthiopiaEuro areaEurope & Central AsiaEurope & Central Asia (excluding high income)Europe & Central Asia (IDA & IBRD countries)European UnionFijiFinlandFragile and conflict affected situationsFranceGabonGambia, TheGeorgiaGermanyGhanaGreeceGrenadaGuatemalaGuineaGuinea-BissauGuyanaHaitiHeavily indebted poor countries (HIPC)High incomeHondurasHong Kong SAR, ChinaHungaryIBRD onlyIcelandIDA & IBRD totalIDA blendIDA onlyIDA totalIndiaIndonesiaIran, Islamic Rep.IraqIrelandIsraelItalyJamaicaJapanJordanKazakhstanKenyaKorea, Rep.KosovoKuwaitKyrgyz RepublicLao PDRLate-demographic dividendLatin America & Caribbean Latin America & Caribbean (excluding high income)Latin America & the Caribbean (IDA & IBRD countries)LatviaLeast developed countries: UN classificationLebanonLesothoLiberiaLibyaLithuaniaLow & middle incomeLow incomeLower middle incomeLuxembourgMacao SAR, ChinaMacedonia, FYRMadagascarMalawiMalaysiaMaldivesMaliMaltaMauritaniaMauritiusMexicoMicronesia, Fed. Sts.Middle East & North AfricaMiddle East & North Africa (excluding high income)Middle East & North Africa (IDA & IBRD countries)Middle incomeMoldovaMongoliaMontenegroMoroccoMozambiqueMyanmarNamibiaNepalNetherlandsNicaraguaNigerNigeriaNorth AmericaNorwayOECD membersOmanOther small statesPacific island small statesPakistanPanamaPapua New GuineaParaguayPeruPhilippinesPolandPortugalPost-demographic dividendPre-demographic dividendQatarRomaniaRussian FederationRwandaSamoaSao Tome and PrincipeSaudi ArabiaSenegalSerbiaSeychellesSierra LeoneSingaporeSlovak RepublicSloveniaSmall statesSolomon IslandsSouth AfricaSouth AsiaSouth Asia (IDA & IBRD)South SudanSpainSri LankaSt. Kitts and NevisSt. LuciaSt. Vincent and the GrenadinesSub-Saharan Africa Sub-Saharan Africa (excluding high income)Sub-Saharan Africa (IDA & IBRD countries)SudanSurinameSwazilandSwedenSwitzerlandSyrian Arab RepublicTajikistanTanzaniaThailandTimor-LesteTogoTongaTrinidad and TobagoTunisiaTurkeyUgandaUkraineUnited KingdomUnited StatesUpper middle incomeUruguayVanuatuVenezuela, RBVietnamWest Bank and GazaWorldYemen, Rep.ZambiaZimbabwe Timeline:
This timeline shows a graph from 1971 to 2016 of United Kingdom. No data until 1970. Number of actual observations by date: 46.
Source name:
World Development Indicators
Source organization:
International Monetary Fund, International Financial Statistics and data files.
Categories, topics:
Financial Sector, External Debt
Last updated:
apr 23, 2017
Indicators value changes by year
At the date of observation
Value
Absolute change
Change from previous value
jan 1, 1971
1.216
+1.216
0.0%
jan 1, 1972
3.358
+2.142
176.2%
jan 1, 1973
1.805
-1.553
-46.25%
jan 1, 1974
1.727
-0.078
-4.3%
jan 1, 1975
1.603
-0.124
-7.17%
jan 1, 1976
1.185
-0.418
-26.08%
jan 1, 1977
0.955
-0.23
-19.42%
jan 1, 1978
3.21
+2.255
236.1%
jan 1, 1979
2.376
-0.834
-25.98%
jan 1, 1980
2.325
-0.051
-2.15%
jan 1, 1981
2.009
-0.316
-13.6%
jan 1, 1982
1.412
-0.597
-29.74%
jan 1, 1983
1.303
-0.108
-7.66%
jan 1, 1984
1.256
-0.048
-3.66%
jan 1, 1985
0.986
-0.269
-21.45%
jan 1, 1986
1.194
+0.208
21.1%
jan 1, 1987
1.47
+0.276
23.07%
jan 1, 1988
2.357
+0.887
60.36%
jan 1, 1989
1.947
-0.41
-17.39%
jan 1, 1990
1.436
-0.511
-26.26%
jan 1, 1991
1.266
-0.17
-11.86%
jan 1, 1992
1.493
+0.228
17.99%
jan 1, 1993
1.338
-0.155
-10.39%
jan 1, 1994
1.446
+0.108
8.08%
jan 1, 1995
1.468
+0.022
1.52%
jan 1, 1996
1.275
-0.193
-13.17%
jan 1, 1997
1.123
-0.152
-11.89%
jan 1, 1998
0.848
-0.275
-24.48%
jan 1, 1999
0.85
+0.001
0.18%
jan 1, 2000
0.795
-0.055
-6.48%
jan 1, 2001
0.812
+0.017
2.16%
jan 1, 2002
0.713
-0.099
-12.16%
jan 1, 2003
0.776
+0.063
8.81%
jan 1, 2004
0.672
-0.104
-13.4%
jan 1, 2005
0.627
-0.045
-6.72%
jan 1, 2006
0.531
-0.096
-15.3%
jan 1, 2007
0.462
-0.069
-12.97%
jan 1, 2008
0.479
+0.017
3.7%
jan 1, 2009
0.454
-0.025
-5.22%
jan 1, 2010
0.843
+0.388
85.53%
jan 1, 2011
0.991
+0.149
17.63%
jan 1, 2012
0.999
+0.008
0.78%
jan 1, 2013
1.121
+0.122
12.25%
jan 1, 2014
1.101
-0.021
-1.85%
jan 1, 2015
1.1
-0.001
-0.06%
jan 1, 2016
1.406
+0.306
27.84%
Ranking of countries by current statistics by years


Comments: