29
/
en
AIzaSyAYiBZKx7MnpbEhh9jyipgxe19OcubqV5w
April 1, 2024
246405
South Africa
ZAF
true
2
1
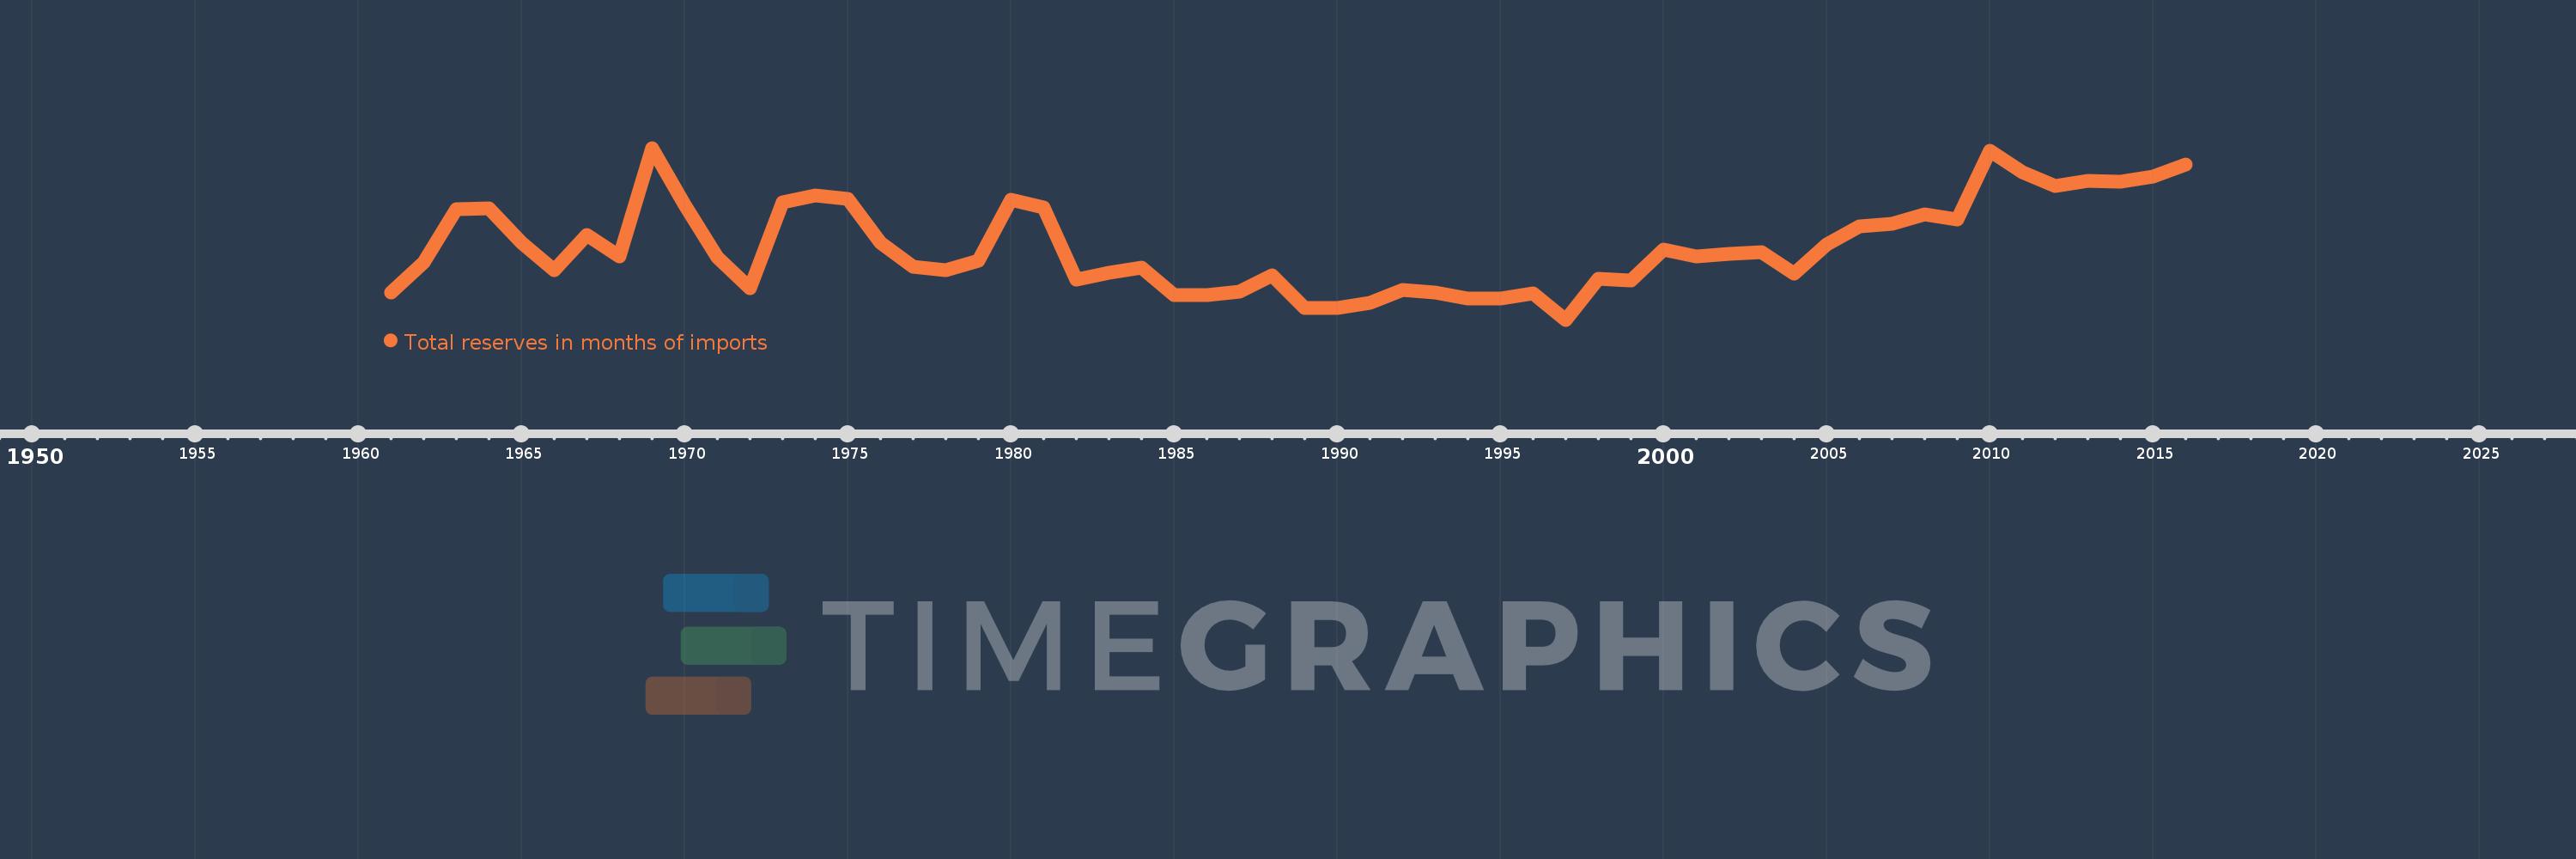
Total reserves in months of imports
2016,2015,2014,2013,2012,2011,2010,2009,2008,2007,2006,2005,2004,2003,2002,2001,2000,1999,1998,1997,1996,1995,1994,1993,1992,1991,1990,1989,1988,1987,1986,1985,1984,1983,1982,1981,1980,1979,1978,1977,1976,1975,1974,1973,1972,1971,1970,1969,1968,1967,1966,1965,1964,1963,1962,1961
This statistics in other country:
AfghanistanAlbaniaAlgeriaAngolaAntigua and BarbudaArab WorldArgentinaArmeniaArubaAustraliaAustriaAzerbaijanBahamas, TheBahrainBangladeshBarbadosBelarusBelgiumBelizeBeninBhutanBoliviaBosnia and HerzegovinaBotswanaBrazilBrunei DarussalamBulgariaBurkina FasoBurundiCabo VerdeCambodiaCameroonCanadaCaribbean small statesCentral African RepublicCentral Europe and the BalticsChadChileChinaColombiaComorosCongo, Dem. Rep.Congo, Rep.Costa RicaCote d'IvoireCroatiaCuracaoCyprusCzech RepublicDenmarkDjiboutiDominicaDominican RepublicEarly-demographic dividendEast Asia & PacificEast Asia & Pacific (excluding high income)East Asia & Pacific (IDA & IBRD countries)EcuadorEgypt, Arab Rep.El SalvadorEquatorial GuineaEritreaEstoniaEthiopiaEuro areaEurope & Central AsiaEurope & Central Asia (excluding high income)Europe & Central Asia (IDA & IBRD countries)European UnionFijiFinlandFragile and conflict affected situationsFranceGabonGambia, TheGeorgiaGermanyGhanaGreeceGrenadaGuatemalaGuineaGuinea-BissauGuyanaHaitiHeavily indebted poor countries (HIPC)High incomeHondurasHong Kong SAR, ChinaHungaryIBRD onlyIcelandIDA & IBRD totalIDA blendIDA onlyIDA totalIndiaIndonesiaIran, Islamic Rep.IraqIrelandIsraelItalyJamaicaJapanJordanKazakhstanKenyaKorea, Rep.KosovoKuwaitKyrgyz RepublicLao PDRLate-demographic dividendLatin America & Caribbean Latin America & Caribbean (excluding high income)Latin America & the Caribbean (IDA & IBRD countries)LatviaLeast developed countries: UN classificationLebanonLesothoLiberiaLibyaLithuaniaLow & middle incomeLow incomeLower middle incomeLuxembourgMacao SAR, ChinaMacedonia, FYRMadagascarMalawiMalaysiaMaldivesMaliMaltaMauritaniaMauritiusMexicoMicronesia, Fed. Sts.Middle East & North AfricaMiddle East & North Africa (excluding high income)Middle East & North Africa (IDA & IBRD countries)Middle incomeMoldovaMongoliaMontenegroMoroccoMozambiqueMyanmarNamibiaNepalNetherlandsNicaraguaNigerNigeriaNorth AmericaNorwayOECD membersOmanOther small statesPacific island small statesPakistanPanamaPapua New GuineaParaguayPeruPhilippinesPolandPortugalPost-demographic dividendPre-demographic dividendQatarRomaniaRussian FederationRwandaSamoaSao Tome and PrincipeSaudi ArabiaSenegalSerbiaSeychellesSierra LeoneSingaporeSlovak RepublicSloveniaSmall statesSolomon IslandsSouth AfricaSouth AsiaSouth Asia (IDA & IBRD)South SudanSpainSri LankaSt. Kitts and NevisSt. LuciaSt. Vincent and the GrenadinesSub-Saharan Africa Sub-Saharan Africa (excluding high income)Sub-Saharan Africa (IDA & IBRD countries)SudanSurinameSwazilandSwedenSwitzerlandSyrian Arab RepublicTajikistanTanzaniaThailandTimor-LesteTogoTongaTrinidad and TobagoTunisiaTurkeyUgandaUkraineUnited KingdomUnited StatesUpper middle incomeUruguayVanuatuVenezuela, RBVietnamWest Bank and GazaWorldYemen, Rep.ZambiaZimbabwe Timeline:
This timeline shows a graph from 1961 to 2016 of South Africa. No data until 1960. Number of actual observations by date: 56.
Source name:
World Development Indicators
Source organization:
International Monetary Fund, International Financial Statistics and data files.
Categories, topics:
Financial Sector, External Debt
Last updated:
apr 23, 2017
Indicators value changes by year
At the date of observation
Value
Absolute change
Change from previous value
jan 1, 1961
1.447
+1.447
0.0%
jan 1, 1962
2.219
+0.772
53.33%
jan 1, 1963
3.607
+1.388
62.54%
jan 1, 1964
3.616
+0.009
0.24%
jan 1, 1965
2.73
-0.886
-24.49%
jan 1, 1966
2.037
-0.693
-25.38%
jan 1, 1967
2.942
+0.905
44.42%
jan 1, 1968
2.387
-0.555
-18.87%
jan 1, 1969
5.177
+2.79
116.88%
jan 1, 1970
3.709
-1.468
-28.36%
jan 1, 1971
2.358
-1.351
-36.43%
jan 1, 1972
1.551
-0.807
-34.22%
jan 1, 1973
3.765
+2.214
142.71%
jan 1, 1974
3.963
+0.198
5.26%
jan 1, 1975
3.865
-0.098
-2.47%
jan 1, 1976
2.733
-1.132
-29.28%
jan 1, 1977
2.108
-0.625
-22.88%
jan 1, 1978
2.029
-0.078
-3.72%
jan 1, 1979
2.263
+0.234
11.53%
jan 1, 1980
3.851
+1.588
70.15%
jan 1, 1981
3.632
-0.219
-5.68%
jan 1, 1982
1.788
-1.844
-50.77%
jan 1, 1983
1.964
+0.176
9.85%
jan 1, 1984
2.093
+0.129
6.55%
jan 1, 1985
1.387
-0.706
-33.75%
jan 1, 1986
1.374
-0.012
-0.88%
jan 1, 1987
1.475
+0.1
7.31%
jan 1, 1988
1.893
+0.419
28.38%
jan 1, 1989
1.048
-0.846
-44.66%
jan 1, 1990
1.05
+0.003
0.25%
jan 1, 1991
1.195
+0.144
13.74%
jan 1, 1992
1.524
+0.33
27.59%
jan 1, 1993
1.454
-0.071
-4.63%
jan 1, 1994
1.302
-0.152
-10.47%
jan 1, 1995
1.303
+0.002
0.14%
jan 1, 1996
1.433
+0.129
9.92%
jan 1, 1997
0.749
-0.684
-47.71%
jan 1, 1998
1.812
+1.062
141.8%
jan 1, 1999
1.761
-0.05
-2.76%
jan 1, 2000
2.55
+0.788
44.75%
jan 1, 2001
2.384
-0.166
-6.5%
jan 1, 2002
2.453
+0.069
2.91%
jan 1, 2003
2.502
+0.049
1.98%
jan 1, 2004
1.928
-0.574
-22.95%
jan 1, 2005
2.689
+0.762
39.51%
jan 1, 2006
3.161
+0.472
17.54%
jan 1, 2007
3.233
+0.071
2.26%
jan 1, 2008
3.458
+0.226
6.98%
jan 1, 2009
3.323
-0.136
-3.92%
jan 1, 2010
5.112
+1.789
53.85%
jan 1, 2011
4.549
-0.563
-11.02%
jan 1, 2012
4.193
-0.356
-7.82%
jan 1, 2013
4.335
+0.143
3.4%
jan 1, 2014
4.313
-0.022
-0.52%
jan 1, 2015
4.447
+0.134
3.1%
jan 1, 2016
4.755
+0.308
6.93%
Ranking of countries by current statistics by years


Comments: