29
/
en
AIzaSyAYiBZKx7MnpbEhh9jyipgxe19OcubqV5w
April 1, 2024
223021
Peru
PER
true
2
1
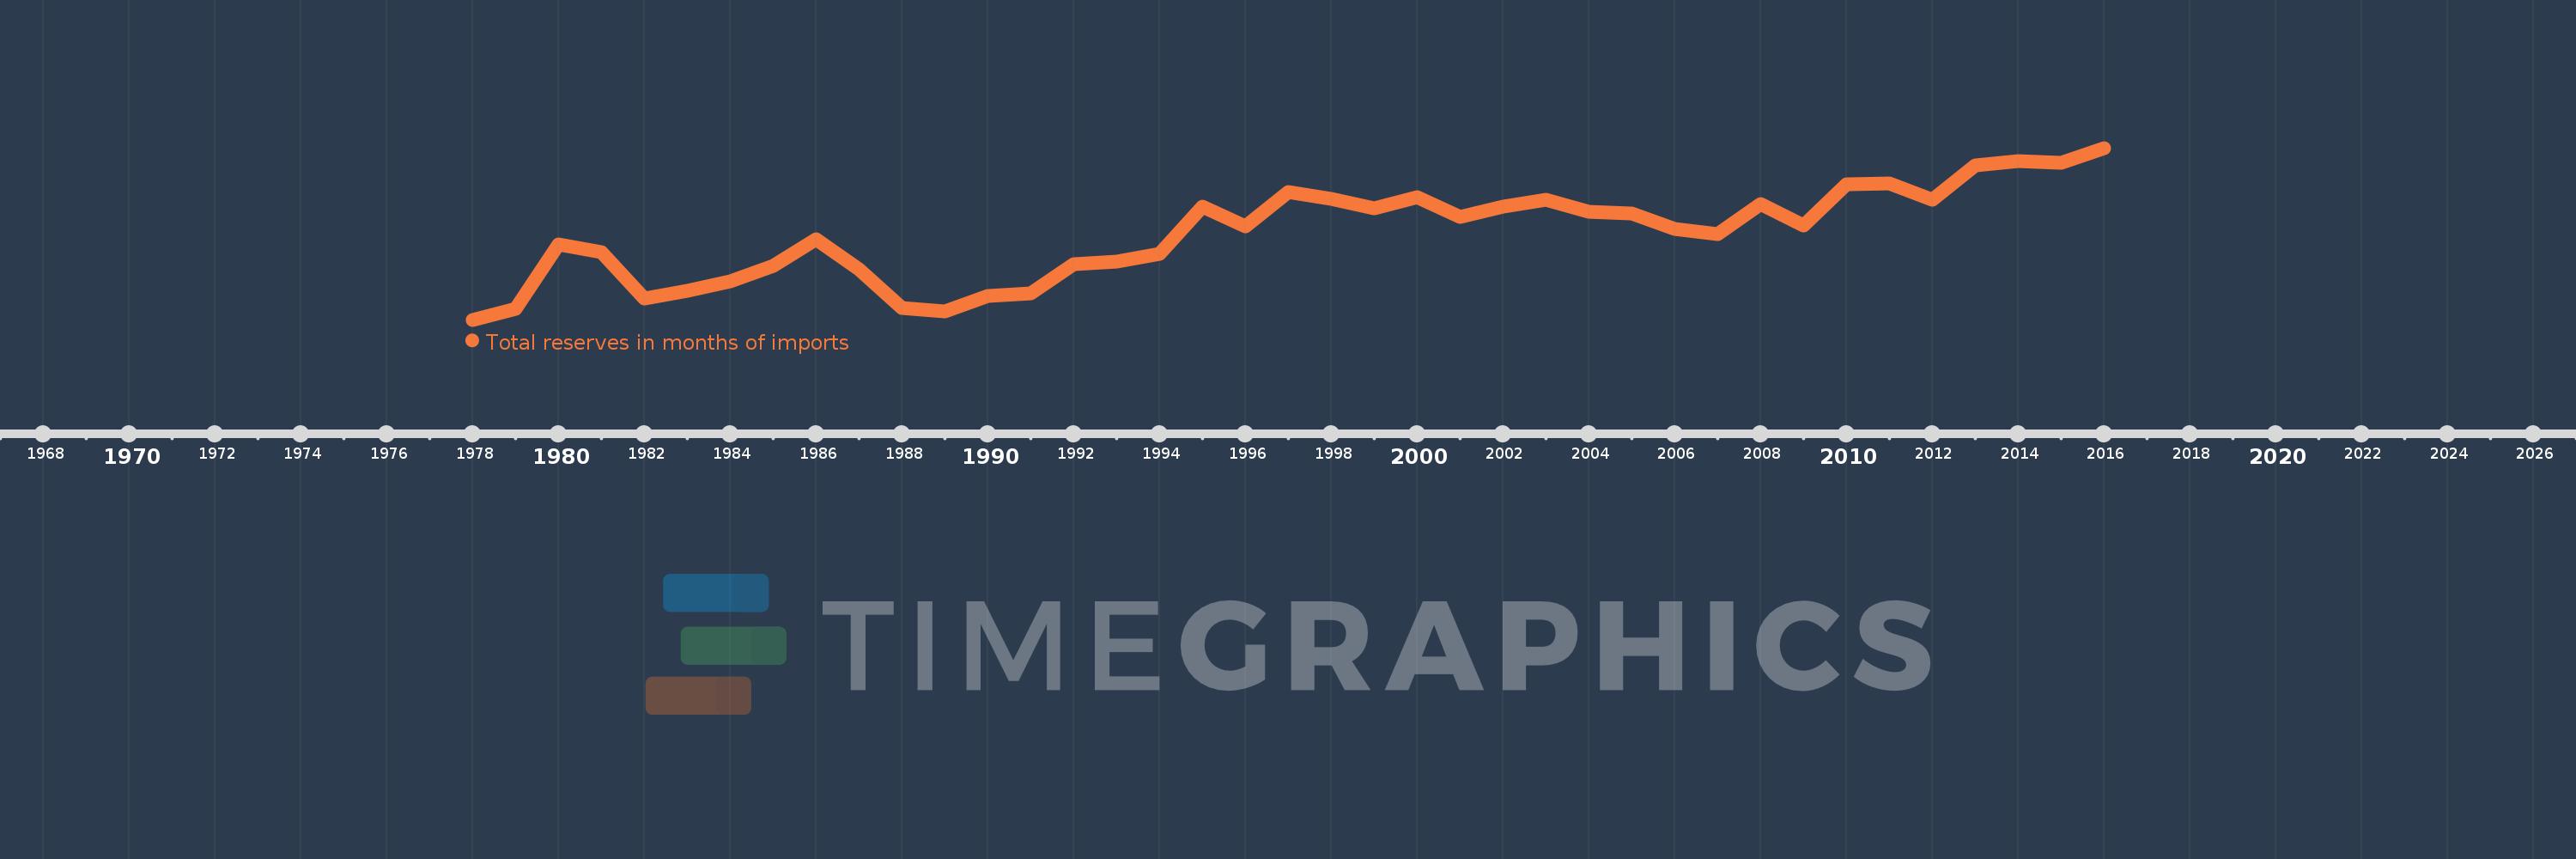
Total reserves in months of imports
2016,2015,2014,2013,2012,2011,2010,2009,2008,2007,2006,2005,2004,2003,2002,2001,2000,1999,1998,1997,1996,1995,1994,1993,1992,1991,1990,1989,1988,1987,1986,1985,1984,1983,1982,1981,1980,1979,1978
This statistics in other country:
AfghanistanAlbaniaAlgeriaAngolaAntigua and BarbudaArab WorldArgentinaArmeniaArubaAustraliaAustriaAzerbaijanBahamas, TheBahrainBangladeshBarbadosBelarusBelgiumBelizeBeninBhutanBoliviaBosnia and HerzegovinaBotswanaBrazilBrunei DarussalamBulgariaBurkina FasoBurundiCabo VerdeCambodiaCameroonCanadaCaribbean small statesCentral African RepublicCentral Europe and the BalticsChadChileChinaColombiaComorosCongo, Dem. Rep.Congo, Rep.Costa RicaCote d'IvoireCroatiaCuracaoCyprusCzech RepublicDenmarkDjiboutiDominicaDominican RepublicEarly-demographic dividendEast Asia & PacificEast Asia & Pacific (excluding high income)East Asia & Pacific (IDA & IBRD countries)EcuadorEgypt, Arab Rep.El SalvadorEquatorial GuineaEritreaEstoniaEthiopiaEuro areaEurope & Central AsiaEurope & Central Asia (excluding high income)Europe & Central Asia (IDA & IBRD countries)European UnionFijiFinlandFragile and conflict affected situationsFranceGabonGambia, TheGeorgiaGermanyGhanaGreeceGrenadaGuatemalaGuineaGuinea-BissauGuyanaHaitiHeavily indebted poor countries (HIPC)High incomeHondurasHong Kong SAR, ChinaHungaryIBRD onlyIcelandIDA & IBRD totalIDA blendIDA onlyIDA totalIndiaIndonesiaIran, Islamic Rep.IraqIrelandIsraelItalyJamaicaJapanJordanKazakhstanKenyaKorea, Rep.KosovoKuwaitKyrgyz RepublicLao PDRLate-demographic dividendLatin America & Caribbean Latin America & Caribbean (excluding high income)Latin America & the Caribbean (IDA & IBRD countries)LatviaLeast developed countries: UN classificationLebanonLesothoLiberiaLibyaLithuaniaLow & middle incomeLow incomeLower middle incomeLuxembourgMacao SAR, ChinaMacedonia, FYRMadagascarMalawiMalaysiaMaldivesMaliMaltaMauritaniaMauritiusMexicoMicronesia, Fed. Sts.Middle East & North AfricaMiddle East & North Africa (excluding high income)Middle East & North Africa (IDA & IBRD countries)Middle incomeMoldovaMongoliaMontenegroMoroccoMozambiqueMyanmarNamibiaNepalNetherlandsNicaraguaNigerNigeriaNorth AmericaNorwayOECD membersOmanOther small statesPacific island small statesPakistanPanamaPapua New GuineaParaguayPeruPhilippinesPolandPortugalPost-demographic dividendPre-demographic dividendQatarRomaniaRussian FederationRwandaSamoaSao Tome and PrincipeSaudi ArabiaSenegalSerbiaSeychellesSierra LeoneSingaporeSlovak RepublicSloveniaSmall statesSolomon IslandsSouth AfricaSouth AsiaSouth Asia (IDA & IBRD)South SudanSpainSri LankaSt. Kitts and NevisSt. LuciaSt. Vincent and the GrenadinesSub-Saharan Africa Sub-Saharan Africa (excluding high income)Sub-Saharan Africa (IDA & IBRD countries)SudanSurinameSwazilandSwedenSwitzerlandSyrian Arab RepublicTajikistanTanzaniaThailandTimor-LesteTogoTongaTrinidad and TobagoTunisiaTurkeyUgandaUkraineUnited KingdomUnited StatesUpper middle incomeUruguayVanuatuVenezuela, RBVietnamWest Bank and GazaWorldYemen, Rep.ZambiaZimbabwe Timeline:
This timeline shows a graph from 1978 to 2016 of Peru. No data until 1977. Number of actual observations by date: 39.
Source name:
World Development Indicators
Source organization:
International Monetary Fund, International Financial Statistics and data files.
Categories, topics:
Financial Sector, External Debt
Last updated:
apr 23, 2017
Indicators value changes by year
Maximum:
13.777
jan 1, 2016
At the date of observation
Value
Absolute change
Change from previous value
jan 1, 1978
2.007
+2.007
0.0%
jan 1, 1979
2.778
+0.771
38.44%
jan 1, 1980
7.173
+4.395
158.23%
jan 1, 1981
6.623
-0.55
-7.67%
jan 1, 1982
3.446
-3.177
-47.97%
jan 1, 1983
4.002
+0.556
16.14%
jan 1, 1984
4.62
+0.617
15.43%
jan 1, 1985
5.668
+1.048
22.68%
jan 1, 1986
7.52
+1.852
32.68%
jan 1, 1987
5.474
-2.046
-27.21%
jan 1, 1988
2.83
-2.644
-48.3%
jan 1, 1989
2.569
-0.261
-9.21%
jan 1, 1990
3.609
+1.04
40.47%
jan 1, 1991
3.79
+0.18
5.0%
jan 1, 1992
5.801
+2.011
53.08%
jan 1, 1993
5.982
+0.181
3.12%
jan 1, 1994
6.493
+0.511
8.55%
jan 1, 1995
9.752
+3.259
50.19%
jan 1, 1996
8.406
-1.347
-13.81%
jan 1, 1997
10.735
+2.329
27.71%
jan 1, 1998
10.306
-0.429
-3.99%
jan 1, 1999
9.625
-0.681
-6.61%
jan 1, 2000
10.408
+0.783
8.14%
jan 1, 2001
9.062
-1.346
-12.94%
jan 1, 2002
9.735
+0.673
7.43%
jan 1, 2003
10.229
+0.494
5.08%
jan 1, 2004
9.383
-0.846
-8.27%
jan 1, 2005
9.304
-0.078
-0.84%
jan 1, 2006
8.243
-1.062
-11.41%
jan 1, 2007
7.902
-0.341
-4.14%
jan 1, 2008
9.936
+2.034
25.74%
jan 1, 2009
8.443
-1.493
-15.03%
jan 1, 2010
11.259
+2.817
33.36%
jan 1, 2011
11.338
+0.079
0.7%
jan 1, 2012
10.22
-1.118
-9.86%
jan 1, 2013
12.586
+2.365
23.14%
jan 1, 2014
12.9
+0.315
2.5%
jan 1, 2015
12.732
-0.169
-1.31%
jan 1, 2016
13.777
+1.045
8.21%
Ranking of countries by current statistics by years


Comments: