29
/
en
AIzaSyAYiBZKx7MnpbEhh9jyipgxe19OcubqV5w
April 1, 2024
86091
Bhutan
BTN
true
2
1
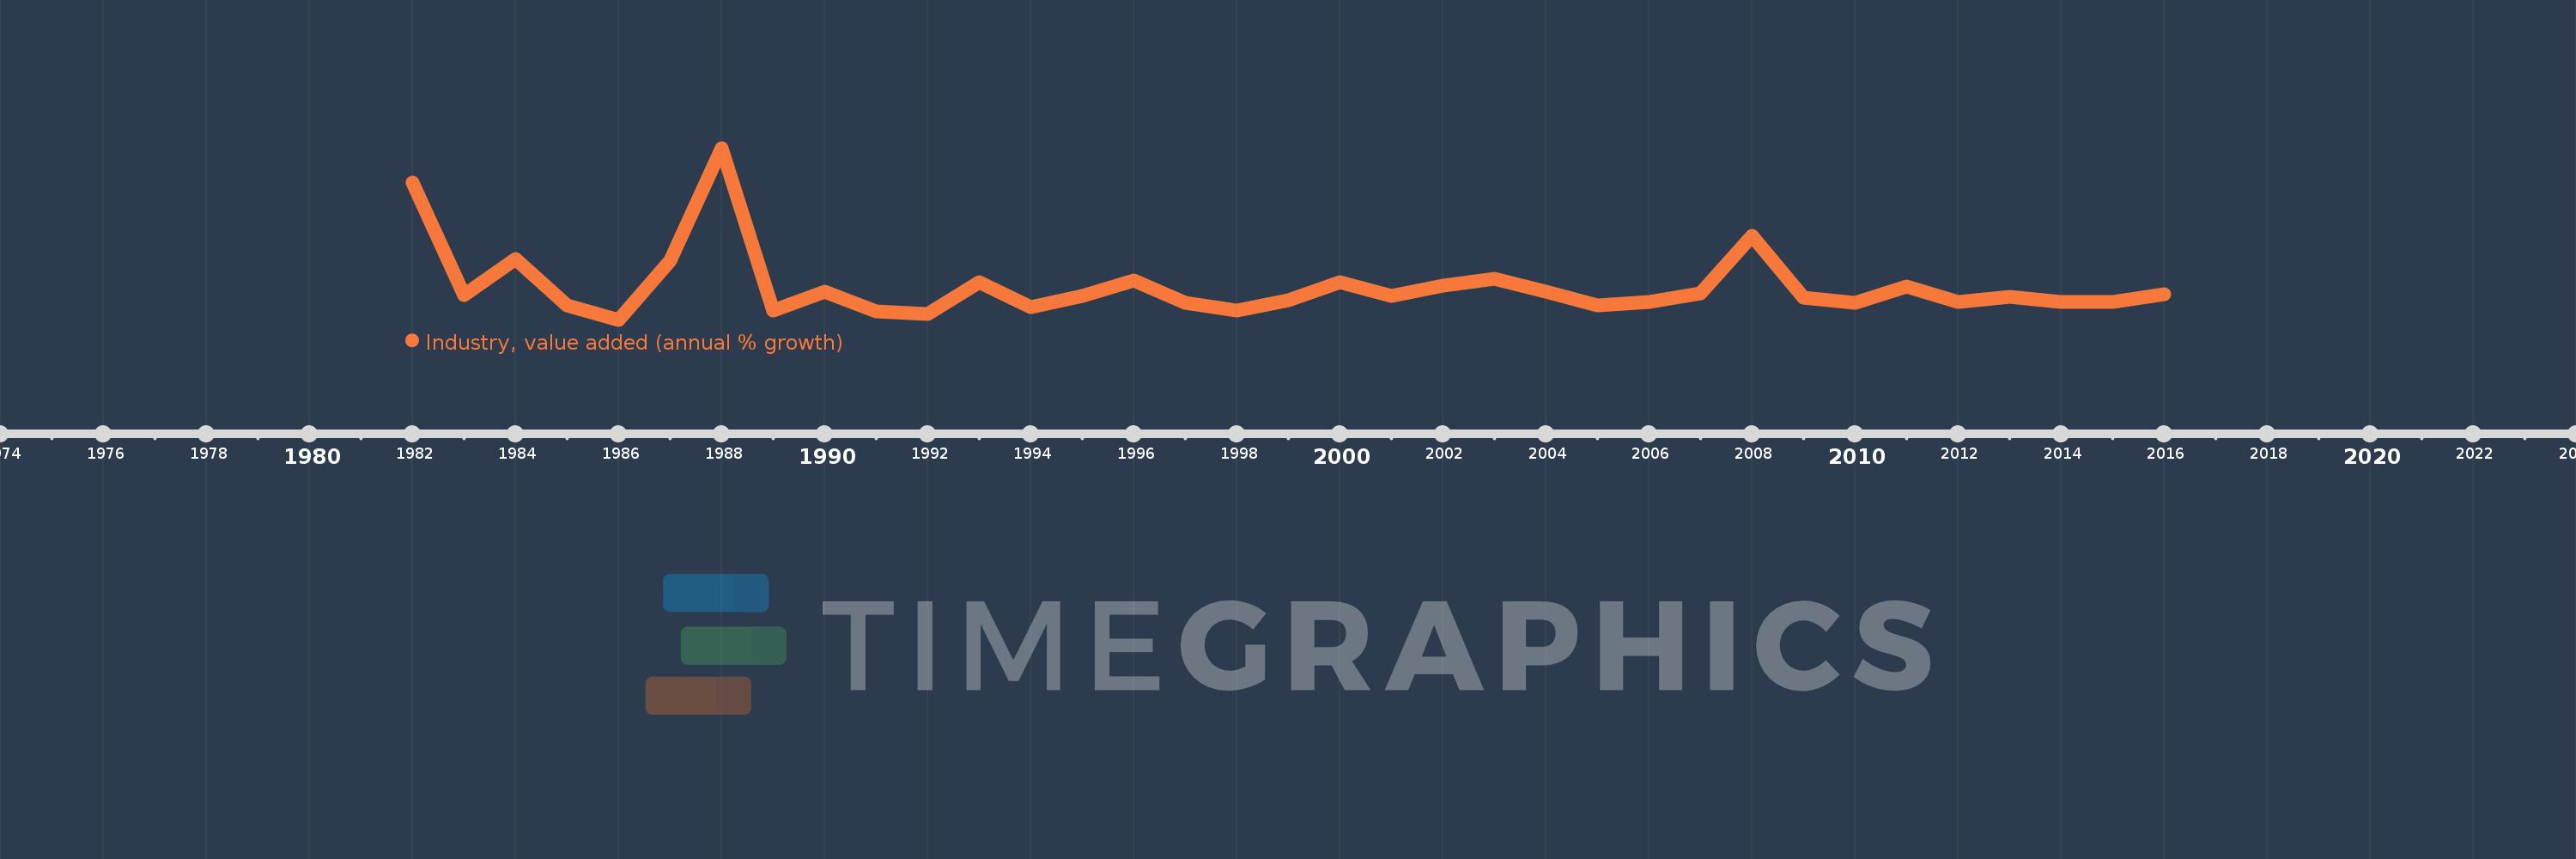
Industry, value added (annual % growth)
2016,2015,2014,2013,2012,2011,2010,2009,2008,2007,2006,2005,2004,2003,2002,2001,2000,1999,1998,1997,1996,1995,1994,1993,1992,1991,1990,1989,1988,1987,1986,1985,1984,1983,1982
This statistics in other country:
AfghanistanAlbaniaAlgeriaAntigua and BarbudaArab WorldArgentinaArmeniaAustraliaAustriaAzerbaijanBahamas, TheBahrainBangladeshBelarusBelgiumBelizeBeninBermudaBhutanBoliviaBosnia and HerzegovinaBotswanaBrazilBrunei DarussalamBulgariaBurkina FasoBurundiCabo VerdeCambodiaCameroonCanadaCaribbean small statesCayman IslandsCentral African RepublicCentral Europe and the BalticsChadChileChinaColombiaComorosCongo, Dem. Rep.Congo, Rep.Costa RicaCote d'IvoireCroatiaCubaCyprusCzech RepublicDenmarkDjiboutiDominicaDominican RepublicEarly-demographic dividendEast Asia & PacificEast Asia & Pacific (excluding high income)East Asia & Pacific (IDA & IBRD countries)EcuadorEgypt, Arab Rep.El SalvadorEquatorial GuineaEritreaEstoniaEthiopiaEuro areaEurope & Central AsiaEurope & Central Asia (excluding high income)Europe & Central Asia (IDA & IBRD countries)European UnionFijiFinlandFragile and conflict affected situationsFranceGabonGambia, TheGeorgiaGermanyGhanaGreeceGrenadaGuatemalaGuineaGuinea-BissauGuyanaHaitiHeavily indebted poor countries (HIPC)High incomeHondurasHong Kong SAR, ChinaHungaryIBRD onlyIcelandIDA & IBRD totalIDA blendIDA onlyIDA totalIndiaIndonesiaIran, Islamic Rep.IraqIrelandItalyJamaicaJapanJordanKazakhstanKenyaKiribatiKorea, Rep.KosovoKuwaitKyrgyz RepublicLao PDRLate-demographic dividendLatin America & Caribbean Latin America & Caribbean (excluding high income)Latin America & the Caribbean (IDA & IBRD countries)LatviaLeast developed countries: UN classificationLebanonLesothoLiberiaLithuaniaLow & middle incomeLow incomeLower middle incomeLuxembourgMacedonia, FYRMadagascarMalawiMalaysiaMaldivesMaliMarshall IslandsMauritaniaMauritiusMexicoMicronesia, Fed. Sts.Middle East & North AfricaMiddle East & North Africa (excluding high income)Middle East & North Africa (IDA & IBRD countries)Middle incomeMoldovaMongoliaMontenegroMoroccoMozambiqueMyanmarNamibiaNepalNetherlandsNew ZealandNicaraguaNigerNigeriaNorth AmericaNorwayOECD membersOmanOther small statesPacific island small statesPakistanPalauPanamaPapua New GuineaParaguayPeruPhilippinesPolandPortugalPost-demographic dividendPre-demographic dividendPuerto RicoQatarRomaniaRussian FederationRwandaSamoaSao Tome and PrincipeSaudi ArabiaSenegalSerbiaSeychellesSierra LeoneSingaporeSlovak RepublicSloveniaSmall statesSolomon IslandsSomaliaSouth AfricaSouth AsiaSouth Asia (IDA & IBRD)SpainSri LankaSt. Kitts and NevisSt. LuciaSt. Vincent and the GrenadinesSub-Saharan Africa Sub-Saharan Africa (excluding high income)Sub-Saharan Africa (IDA & IBRD countries)SudanSurinameSwazilandSwedenSwitzerlandSyrian Arab RepublicTajikistanTanzaniaThailandTimor-LesteTogoTongaTrinidad and TobagoTunisiaTurkeyTurkmenistanTuvaluUgandaUkraineUnited Arab EmiratesUnited KingdomUnited StatesUpper middle incomeUruguayUzbekistanVanuatuVenezuela, RBVietnamWest Bank and GazaWorldZambiaZimbabwe Timeline:
This timeline shows a graph from 1982 to 2016 of Bhutan. No data until 1981. Number of actual observations by date: 35.
Source name:
World Development Indicators
Source organization:
World Bank national accounts data, and OECD National Accounts data files.
Categories, topics:
Economy & Growth
Last updated:
apr 23, 2017
Indicators value changes by year
Minimum:
-5.905
jan 1, 1986
Maximum:
89.217
jan 1, 1988
At the date of observation
Value
Absolute change
Change from previous value
jan 1, 1982
69.982
+69.982
0.0%
jan 1, 1983
7.54
-62.442
-89.23%
jan 1, 1984
27.951
+20.411
270.72%
jan 1, 1985
2.205
-25.746
-92.11%
jan 1, 1986
-5.905
-8.11
-367.78%
jan 1, 1987
26.91
+32.815
-555.7%
jan 1, 1988
89.217
+62.308
231.54%
jan 1, 1989
-0.802
-90.019
-100.9%
jan 1, 1990
9.794
+10.596
-1.32K%
jan 1, 1991
-1.266
-11.06
-112.93%
jan 1, 1992
-2.591
-1.325
104.66%
jan 1, 1993
15.033
+17.624
-680.08%
jan 1, 1994
1.322
-13.711
-91.2%
jan 1, 1995
7.036
+5.714
432.16%
jan 1, 1996
15.961
+8.925
126.85%
jan 1, 1997
3.584
-12.378
-77.55%
jan 1, 1998
-0.842
-4.426
-123.5%
jan 1, 1999
4.692
+5.534
-657.02%
jan 1, 2000
15.076
+10.385
221.35%
jan 1, 2001
7.257
-7.82
-51.87%
jan 1, 2002
12.765
+5.508
75.91%
jan 1, 2003
16.762
+3.997
31.31%
jan 1, 2004
9.611
-7.151
-42.66%
jan 1, 2005
2.034
-7.577
-78.83%
jan 1, 2006
3.776
+1.741
85.6%
jan 1, 2007
8.836
+5.06
134.02%
jan 1, 2008
40.683
+31.847
360.43%
jan 1, 2009
6.288
-34.396
-84.54%
jan 1, 2010
3.457
-2.831
-45.02%
jan 1, 2011
12.481
+9.024
261.06%
jan 1, 2012
4.059
-8.422
-67.48%
jan 1, 2013
6.768
+2.709
66.75%
jan 1, 2014
3.902
-2.866
-42.35%
jan 1, 2015
3.712
-0.19
-4.86%
jan 1, 2016
8.127
+4.415
118.93%
Ranking of countries by current statistics by years


Comments: