29
/
en
AIzaSyAYiBZKx7MnpbEhh9jyipgxe19OcubqV5w
April 1, 2024
26611
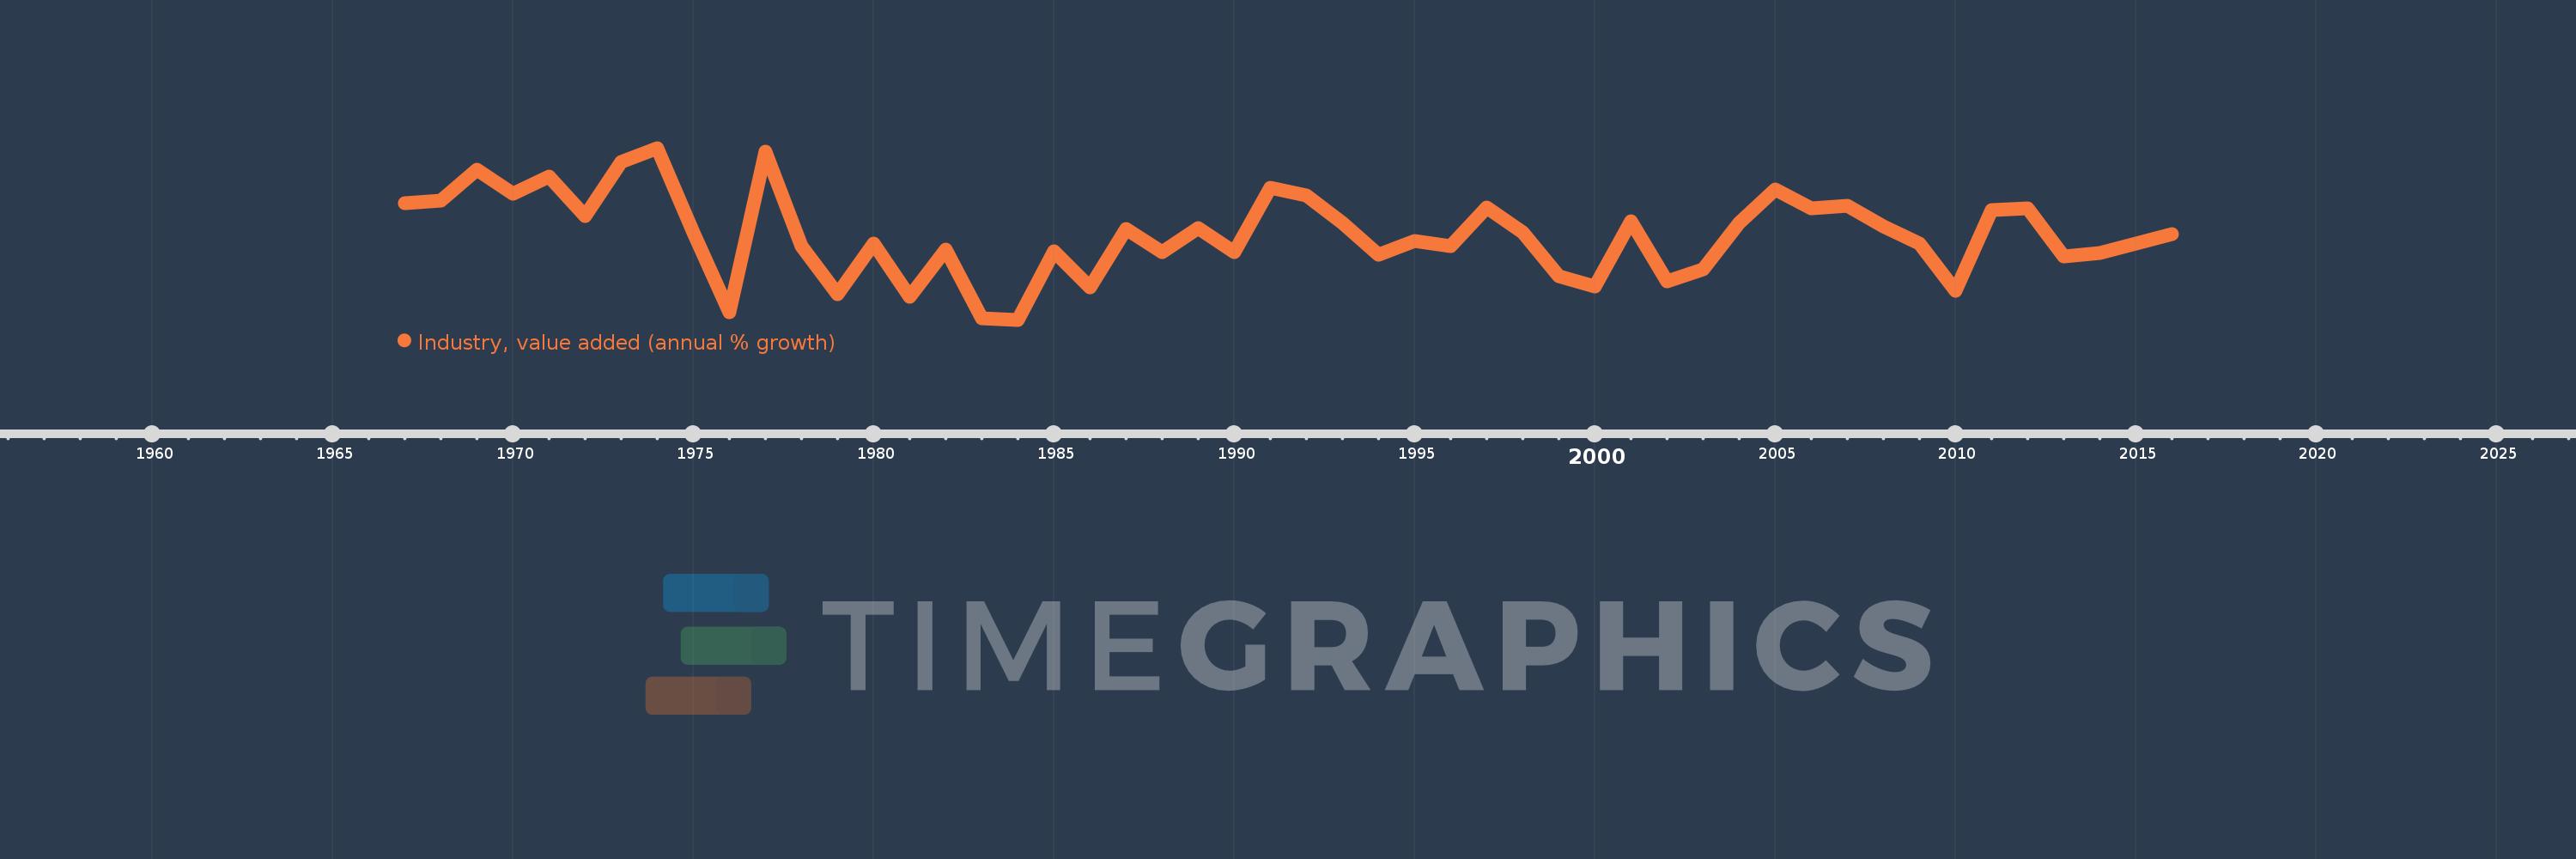
Early-demographic dividend
EAR
false
2
1
Industry, value added (annual % growth)
2016,2015,2014,2013,2012,2011,2010,2009,2008,2007,2006,2005,2004,2003,2002,2001,2000,1999,1998,1997,1996,1995,1994,1993,1992,1991,1990,1989,1988,1987,1986,1985,1984,1983,1982,1981,1980,1979,1978,1977,1976,1975,1974,1973,1972,1971,1970,1969,1968,1967
This statistics in other country:
AfghanistanAlbaniaAlgeriaAntigua and BarbudaArab WorldArgentinaArmeniaAustraliaAustriaAzerbaijanBahamas, TheBahrainBangladeshBelarusBelgiumBelizeBeninBermudaBhutanBoliviaBosnia and HerzegovinaBotswanaBrazilBrunei DarussalamBulgariaBurkina FasoBurundiCabo VerdeCambodiaCameroonCanadaCaribbean small statesCayman IslandsCentral African RepublicCentral Europe and the BalticsChadChileChinaColombiaComorosCongo, Dem. Rep.Congo, Rep.Costa RicaCote d'IvoireCroatiaCubaCyprusCzech RepublicDenmarkDjiboutiDominicaDominican RepublicEarly-demographic dividendEast Asia & PacificEast Asia & Pacific (excluding high income)East Asia & Pacific (IDA & IBRD countries)EcuadorEgypt, Arab Rep.El SalvadorEquatorial GuineaEritreaEstoniaEthiopiaEuro areaEurope & Central AsiaEurope & Central Asia (excluding high income)Europe & Central Asia (IDA & IBRD countries)European UnionFijiFinlandFragile and conflict affected situationsFranceGabonGambia, TheGeorgiaGermanyGhanaGreeceGrenadaGuatemalaGuineaGuinea-BissauGuyanaHaitiHeavily indebted poor countries (HIPC)High incomeHondurasHong Kong SAR, ChinaHungaryIBRD onlyIcelandIDA & IBRD totalIDA blendIDA onlyIDA totalIndiaIndonesiaIran, Islamic Rep.IraqIrelandItalyJamaicaJapanJordanKazakhstanKenyaKiribatiKorea, Rep.KosovoKuwaitKyrgyz RepublicLao PDRLate-demographic dividendLatin America & Caribbean Latin America & Caribbean (excluding high income)Latin America & the Caribbean (IDA & IBRD countries)LatviaLeast developed countries: UN classificationLebanonLesothoLiberiaLithuaniaLow & middle incomeLow incomeLower middle incomeLuxembourgMacedonia, FYRMadagascarMalawiMalaysiaMaldivesMaliMarshall IslandsMauritaniaMauritiusMexicoMicronesia, Fed. Sts.Middle East & North AfricaMiddle East & North Africa (excluding high income)Middle East & North Africa (IDA & IBRD countries)Middle incomeMoldovaMongoliaMontenegroMoroccoMozambiqueMyanmarNamibiaNepalNetherlandsNew ZealandNicaraguaNigerNigeriaNorth AmericaNorwayOECD membersOmanOther small statesPacific island small statesPakistanPalauPanamaPapua New GuineaParaguayPeruPhilippinesPolandPortugalPost-demographic dividendPre-demographic dividendPuerto RicoQatarRomaniaRussian FederationRwandaSamoaSao Tome and PrincipeSaudi ArabiaSenegalSerbiaSeychellesSierra LeoneSingaporeSlovak RepublicSloveniaSmall statesSolomon IslandsSomaliaSouth AfricaSouth AsiaSouth Asia (IDA & IBRD)SpainSri LankaSt. Kitts and NevisSt. LuciaSt. Vincent and the GrenadinesSub-Saharan Africa Sub-Saharan Africa (excluding high income)Sub-Saharan Africa (IDA & IBRD countries)SudanSurinameSwazilandSwedenSwitzerlandSyrian Arab RepublicTajikistanTanzaniaThailandTimor-LesteTogoTongaTrinidad and TobagoTunisiaTurkeyTurkmenistanTuvaluUgandaUkraineUnited Arab EmiratesUnited KingdomUnited StatesUpper middle incomeUruguayUzbekistanVanuatuVenezuela, RBVietnamWest Bank and GazaWorldZambiaZimbabwe Timeline:
This timeline shows a graph from 1967 to 2016 of Early-demographic dividend. No data until 1966. Number of actual observations by date: 50.
Source name:
World Development Indicators
Source organization:
World Bank national accounts data, and OECD National Accounts data files.
Categories, topics:
Economy & Growth
Last updated:
apr 23, 2017
Indicators value changes by year
Minimum:
-3.007
jan 1, 1984
Maximum:
10.829
jan 1, 1974
At the date of observation
Value
Absolute change
Change from previous value
jan 1, 1967
6.347
+6.347
0.0%
jan 1, 1968
6.558
+0.211
3.33%
jan 1, 1969
9.096
+2.538
38.7%
jan 1, 1970
7.175
-1.921
-21.11%
jan 1, 1971
8.544
+1.369
19.08%
jan 1, 1972
5.325
-3.219
-37.68%
jan 1, 1973
9.706
+4.381
82.27%
jan 1, 1974
10.829
+1.123
11.57%
jan 1, 1975
4.035
-6.794
-62.74%
jan 1, 1976
-2.415
-6.45
-159.85%
jan 1, 1977
10.535
+12.95
-536.2%
jan 1, 1978
2.946
-7.589
-72.04%
jan 1, 1979
-0.92
-3.866
-131.24%
jan 1, 1980
3.126
+4.047
-439.67%
jan 1, 1981
-1.159
-4.285
-137.07%
jan 1, 1982
2.638
+3.797
-327.6%
jan 1, 1983
-2.915
-5.553
-210.49%
jan 1, 1984
-3.007
-0.092
3.15%
jan 1, 1985
2.494
+5.501
-182.95%
jan 1, 1986
-0.428
-2.922
-117.17%
jan 1, 1987
4.307
+4.735
-1.11K%
jan 1, 1988
2.41
-1.897
-44.05%
jan 1, 1989
4.387
+1.978
82.09%
jan 1, 1990
2.472
-1.916
-43.66%
jan 1, 1991
7.65
+5.178
209.49%
jan 1, 1992
6.977
-0.674
-8.8%
jan 1, 1993
4.785
-2.192
-31.41%
jan 1, 1994
2.2
-2.585
-54.03%
jan 1, 1995
3.352
+1.152
52.39%
jan 1, 1996
2.889
-0.463
-13.81%
jan 1, 1997
6.03
+3.141
108.71%
jan 1, 1998
4.048
-1.983
-32.88%
jan 1, 1999
0.523
-3.525
-87.09%
jan 1, 2000
-0.323
-0.846
-161.87%
jan 1, 2001
4.947
+5.27
-1.63K%
jan 1, 2002
0.112
-4.835
-97.73%
jan 1, 2003
1.088
+0.975
869.12%
jan 1, 2004
4.766
+3.679
338.2%
jan 1, 2005
7.506
+2.739
57.47%
jan 1, 2006
5.992
-1.513
-20.16%
jan 1, 2007
6.146
+0.154
2.57%
jan 1, 2008
4.509
-1.637
-26.63%
jan 1, 2009
3.155
-1.354
-30.02%
jan 1, 2010
-0.697
-3.852
-122.1%
jan 1, 2011
5.859
+6.556
-940.29%
jan 1, 2012
5.991
+0.132
2.25%
jan 1, 2013
2.059
-3.932
-65.64%
jan 1, 2014
2.378
+0.319
15.51%
jan 1, 2015
3.118
+0.741
31.15%
jan 1, 2016
3.857
+0.738
23.67%
Ranking of countries by current statistics by years


Comments: