29
/
en
AIzaSyAYiBZKx7MnpbEhh9jyipgxe19OcubqV5w
April 1, 2024
51011
Middle income
MIC
false
2
1
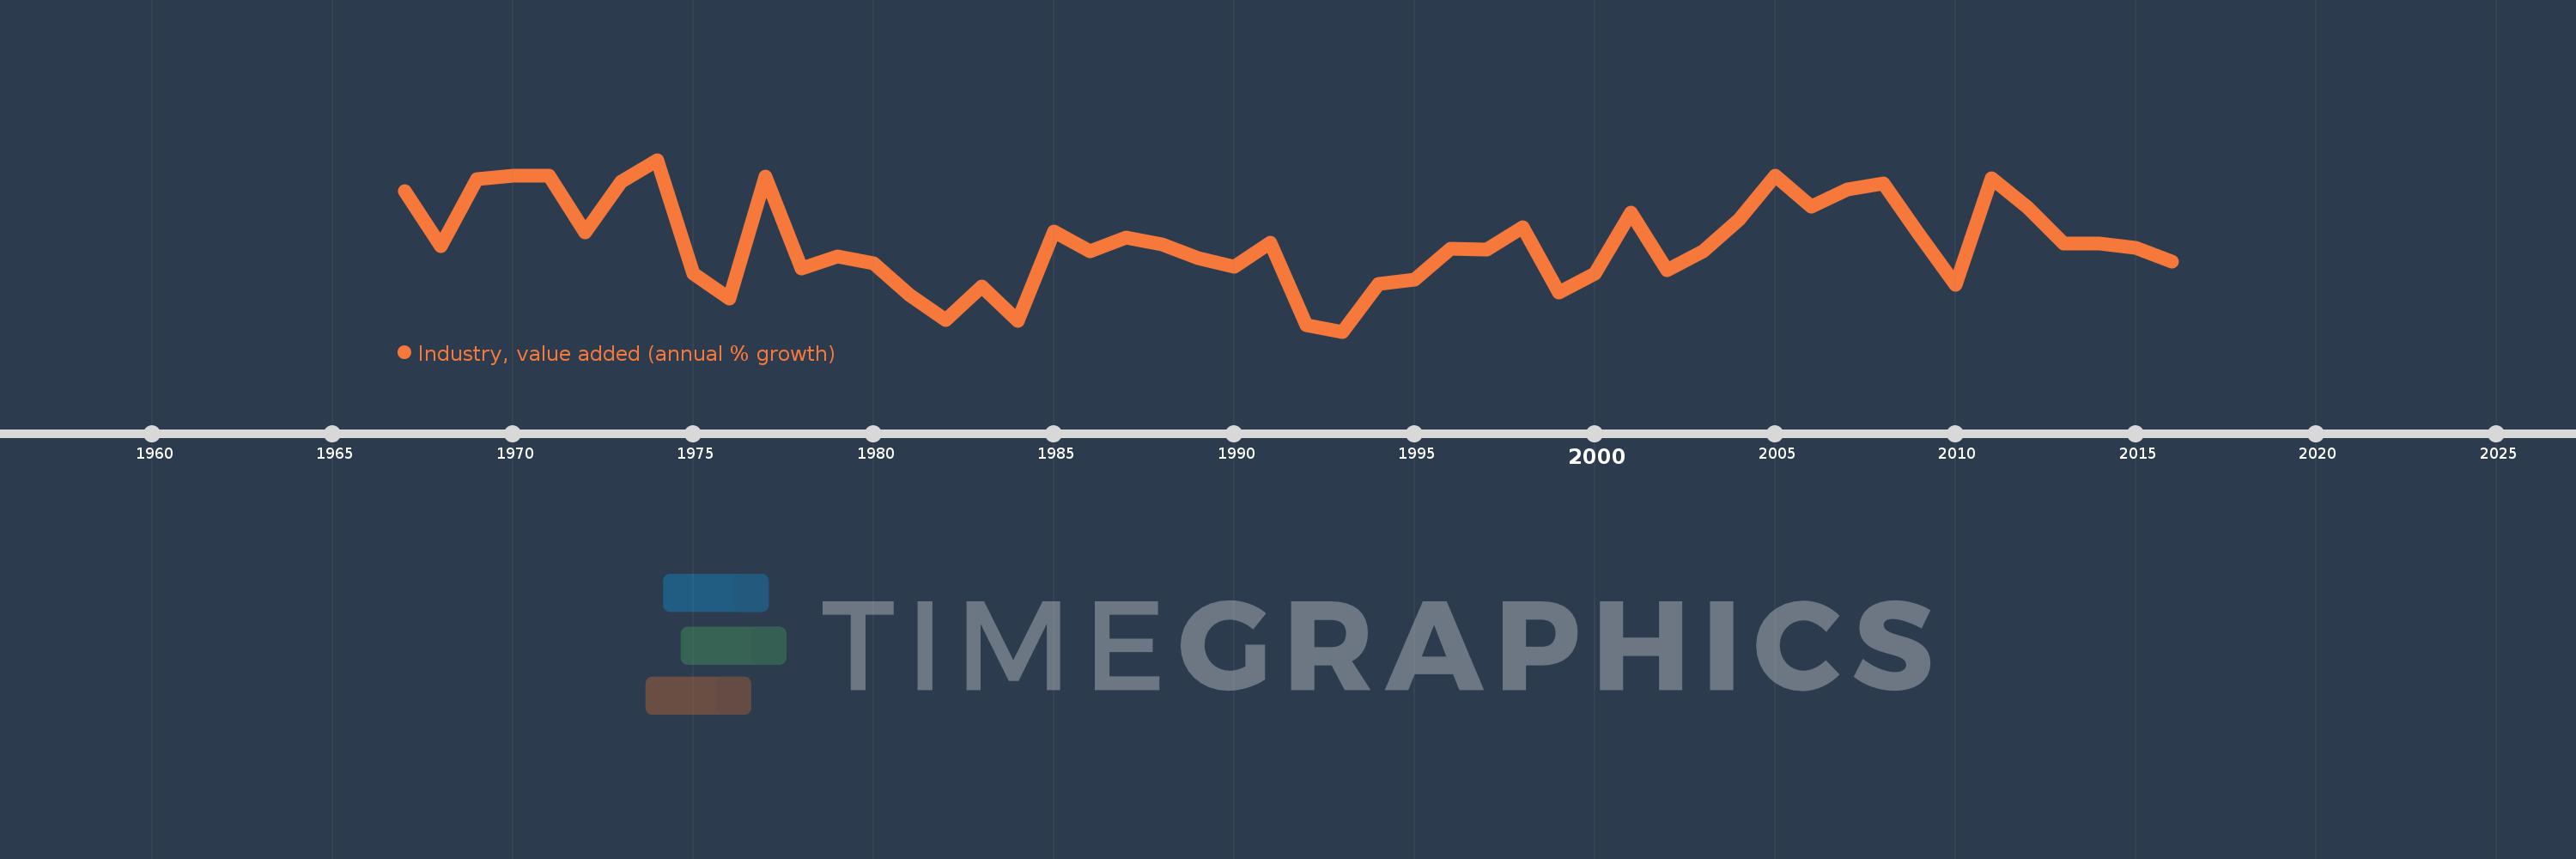
Industry, value added (annual % growth)
2016,2015,2014,2013,2012,2011,2010,2009,2008,2007,2006,2005,2004,2003,2002,2001,2000,1999,1998,1997,1996,1995,1994,1993,1992,1991,1990,1989,1988,1987,1986,1985,1984,1983,1982,1981,1980,1979,1978,1977,1976,1975,1974,1973,1972,1971,1970,1969,1968,1967
This statistics in other country:
AfghanistanAlbaniaAlgeriaAntigua and BarbudaArab WorldArgentinaArmeniaAustraliaAustriaAzerbaijanBahamas, TheBahrainBangladeshBelarusBelgiumBelizeBeninBermudaBhutanBoliviaBosnia and HerzegovinaBotswanaBrazilBrunei DarussalamBulgariaBurkina FasoBurundiCabo VerdeCambodiaCameroonCanadaCaribbean small statesCayman IslandsCentral African RepublicCentral Europe and the BalticsChadChileChinaColombiaComorosCongo, Dem. Rep.Congo, Rep.Costa RicaCote d'IvoireCroatiaCubaCyprusCzech RepublicDenmarkDjiboutiDominicaDominican RepublicEarly-demographic dividendEast Asia & PacificEast Asia & Pacific (excluding high income)East Asia & Pacific (IDA & IBRD countries)EcuadorEgypt, Arab Rep.El SalvadorEquatorial GuineaEritreaEstoniaEthiopiaEuro areaEurope & Central AsiaEurope & Central Asia (excluding high income)Europe & Central Asia (IDA & IBRD countries)European UnionFijiFinlandFragile and conflict affected situationsFranceGabonGambia, TheGeorgiaGermanyGhanaGreeceGrenadaGuatemalaGuineaGuinea-BissauGuyanaHaitiHeavily indebted poor countries (HIPC)High incomeHondurasHong Kong SAR, ChinaHungaryIBRD onlyIcelandIDA & IBRD totalIDA blendIDA onlyIDA totalIndiaIndonesiaIran, Islamic Rep.IraqIrelandItalyJamaicaJapanJordanKazakhstanKenyaKiribatiKorea, Rep.KosovoKuwaitKyrgyz RepublicLao PDRLate-demographic dividendLatin America & Caribbean Latin America & Caribbean (excluding high income)Latin America & the Caribbean (IDA & IBRD countries)LatviaLeast developed countries: UN classificationLebanonLesothoLiberiaLithuaniaLow & middle incomeLow incomeLower middle incomeLuxembourgMacedonia, FYRMadagascarMalawiMalaysiaMaldivesMaliMarshall IslandsMauritaniaMauritiusMexicoMicronesia, Fed. Sts.Middle East & North AfricaMiddle East & North Africa (excluding high income)Middle East & North Africa (IDA & IBRD countries)Middle incomeMoldovaMongoliaMontenegroMoroccoMozambiqueMyanmarNamibiaNepalNetherlandsNew ZealandNicaraguaNigerNigeriaNorth AmericaNorwayOECD membersOmanOther small statesPacific island small statesPakistanPalauPanamaPapua New GuineaParaguayPeruPhilippinesPolandPortugalPost-demographic dividendPre-demographic dividendPuerto RicoQatarRomaniaRussian FederationRwandaSamoaSao Tome and PrincipeSaudi ArabiaSenegalSerbiaSeychellesSierra LeoneSingaporeSlovak RepublicSloveniaSmall statesSolomon IslandsSomaliaSouth AfricaSouth AsiaSouth Asia (IDA & IBRD)SpainSri LankaSt. Kitts and NevisSt. LuciaSt. Vincent and the GrenadinesSub-Saharan Africa Sub-Saharan Africa (excluding high income)Sub-Saharan Africa (IDA & IBRD countries)SudanSurinameSwazilandSwedenSwitzerlandSyrian Arab RepublicTajikistanTanzaniaThailandTimor-LesteTogoTongaTrinidad and TobagoTunisiaTurkeyTurkmenistanTuvaluUgandaUkraineUnited Arab EmiratesUnited KingdomUnited StatesUpper middle incomeUruguayUzbekistanVanuatuVenezuela, RBVietnamWest Bank and GazaWorldZambiaZimbabwe Timeline:
This timeline shows a graph from 1967 to 2016 of Middle income. No data until 1966. Number of actual observations by date: 50.
Source name:
World Development Indicators
Source organization:
World Bank national accounts data, and OECD National Accounts data files.
Categories, topics:
Economy & Growth
Last updated:
apr 23, 2017
Indicators value changes by year
Minimum:
-0.625
jan 1, 1993
At the date of observation
Value
Absolute change
Change from previous value
jan 1, 1967
7.936
+7.936
0.0%
jan 1, 1968
4.62
-3.317
-41.79%
jan 1, 1969
8.687
+4.067
88.04%
jan 1, 1970
8.88
+0.193
2.22%
jan 1, 1971
8.885
+0.005
0.05%
jan 1, 1972
5.446
-3.439
-38.7%
jan 1, 1973
8.545
+3.098
56.89%
jan 1, 1974
9.87
+1.325
15.51%
jan 1, 1975
2.914
-6.956
-70.48%
jan 1, 1976
1.385
-1.529
-52.46%
jan 1, 1977
8.872
+7.487
540.49%
jan 1, 1978
3.21
-5.663
-63.82%
jan 1, 1979
3.961
+0.752
23.42%
jan 1, 1980
3.549
-0.412
-10.41%
jan 1, 1981
1.612
-1.937
-54.58%
jan 1, 1982
0.059
-1.553
-96.34%
jan 1, 1983
2.15
+2.091
3.55K%
jan 1, 1984
0.027
-2.123
-98.76%
jan 1, 1985
5.475
+5.448
20.43K%
jan 1, 1986
4.291
-1.184
-21.63%
jan 1, 1987
5.145
+0.855
19.92%
jan 1, 1988
4.681
-0.464
-9.03%
jan 1, 1989
3.876
-0.805
-17.21%
jan 1, 1990
3.329
-0.547
-14.11%
jan 1, 1991
4.803
+1.475
44.31%
jan 1, 1992
-0.256
-5.059
-105.32%
jan 1, 1993
-0.625
-0.369
144.42%
jan 1, 1994
2.272
+2.897
-463.68%
jan 1, 1995
2.524
+0.252
11.1%
jan 1, 1996
4.453
+1.929
76.41%
jan 1, 1997
4.384
-0.069
-1.56%
jan 1, 1998
5.747
+1.363
31.1%
jan 1, 1999
1.782
-3.965
-68.99%
jan 1, 2000
2.894
+1.112
62.38%
jan 1, 2001
6.632
+3.738
129.17%
jan 1, 2002
3.128
-3.504
-52.84%
jan 1, 2003
4.287
+1.159
37.04%
jan 1, 2004
6.201
+1.914
44.66%
jan 1, 2005
8.925
+2.724
43.93%
jan 1, 2006
7.032
-1.893
-21.21%
jan 1, 2007
8.065
+1.033
14.69%
jan 1, 2008
8.407
+0.341
4.23%
jan 1, 2009
5.291
-3.115
-37.06%
jan 1, 2010
2.26
-3.032
-57.3%
jan 1, 2011
8.737
+6.477
286.67%
jan 1, 2012
6.975
-1.762
-20.17%
jan 1, 2013
4.736
-2.239
-32.1%
jan 1, 2014
4.774
+0.038
0.81%
jan 1, 2015
4.469
-0.305
-6.39%
jan 1, 2016
3.66
-0.809
-18.11%
Ranking of countries by current statistics by years


Comments: