29
/
en
AIzaSyAYiBZKx7MnpbEhh9jyipgxe19OcubqV5w
April 1, 2024
259735
Tajikistan
TJK
true
2
1
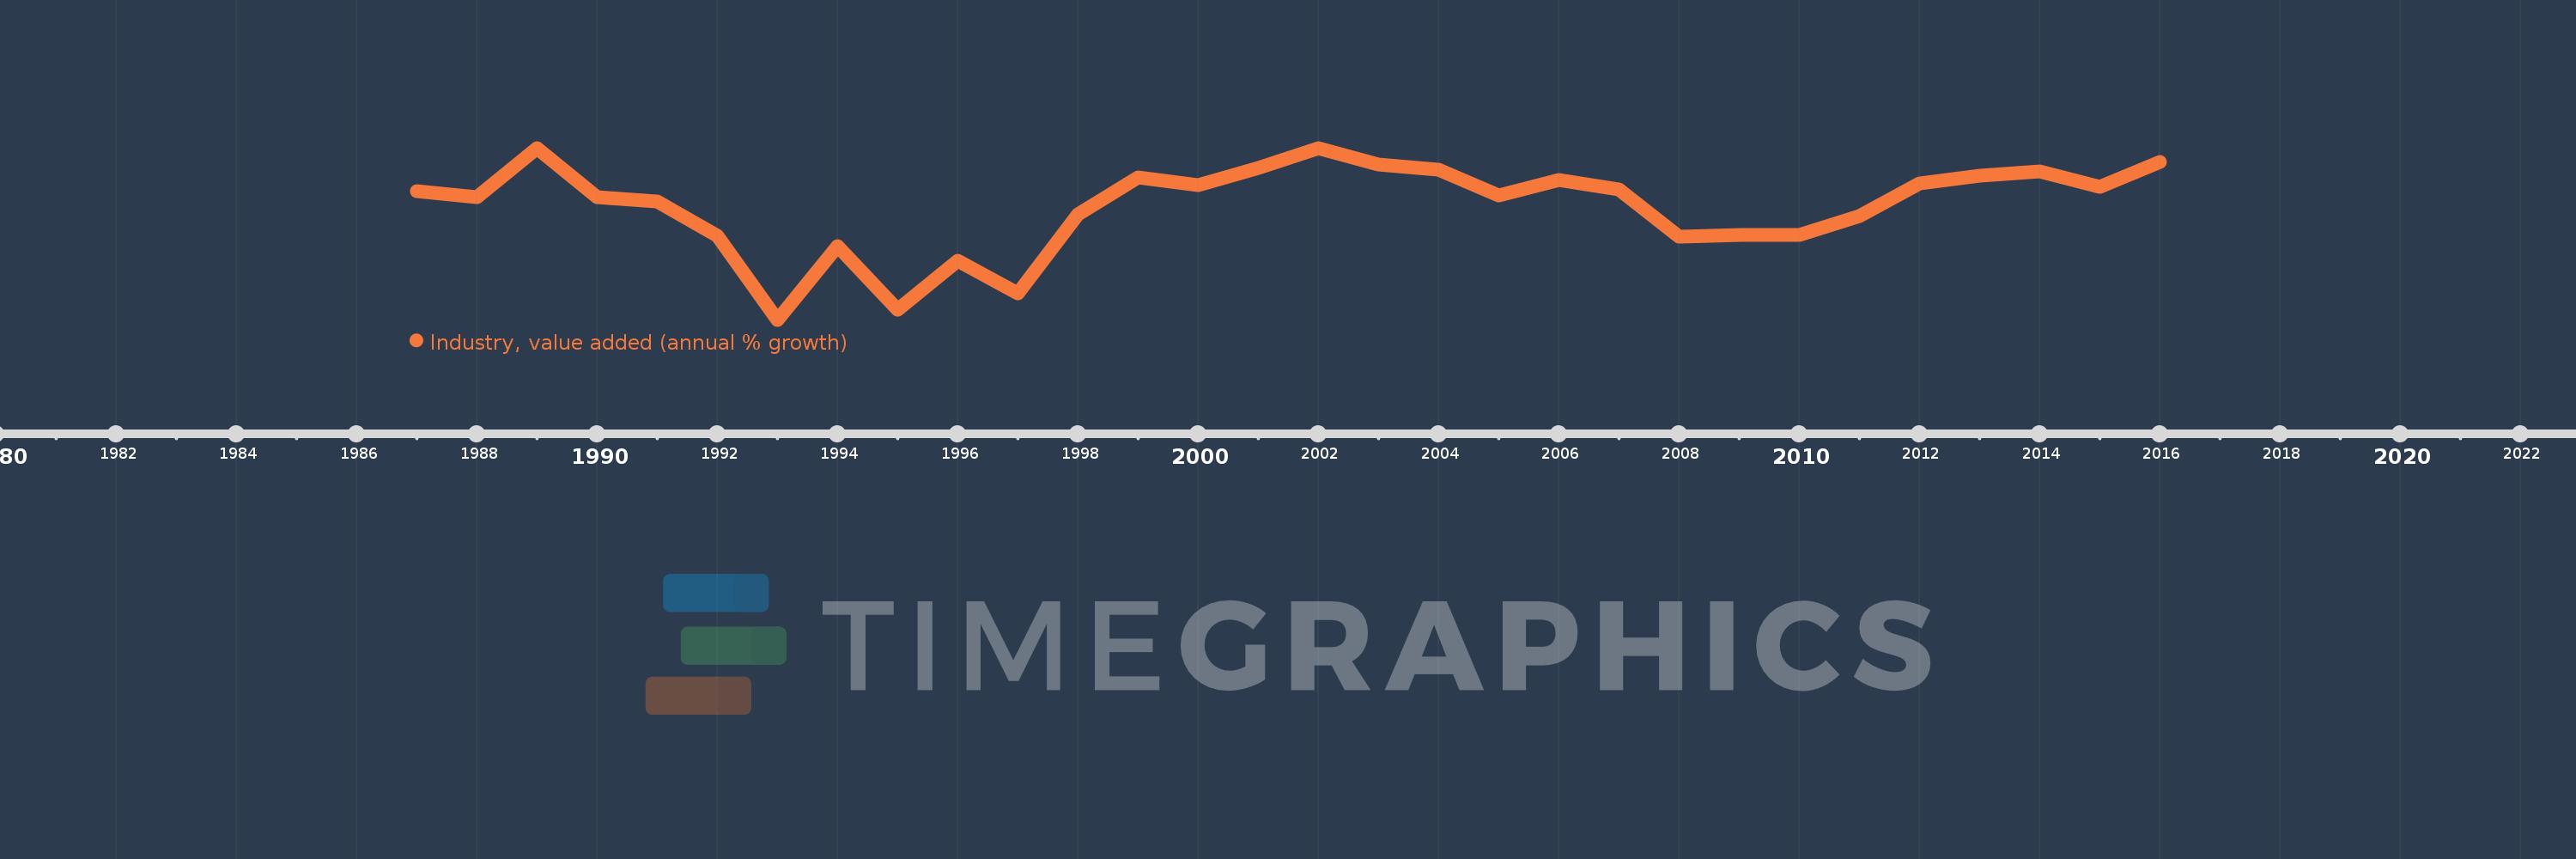
Industry, value added (annual % growth)
2016,2015,2014,2013,2012,2011,2010,2009,2008,2007,2006,2005,2004,2003,2002,2001,2000,1999,1998,1997,1996,1995,1994,1993,1992,1991,1990,1989,1988,1987
This statistics in other country:
AfghanistanAlbaniaAlgeriaAntigua and BarbudaArab WorldArgentinaArmeniaAustraliaAustriaAzerbaijanBahamas, TheBahrainBangladeshBelarusBelgiumBelizeBeninBermudaBhutanBoliviaBosnia and HerzegovinaBotswanaBrazilBrunei DarussalamBulgariaBurkina FasoBurundiCabo VerdeCambodiaCameroonCanadaCaribbean small statesCayman IslandsCentral African RepublicCentral Europe and the BalticsChadChileChinaColombiaComorosCongo, Dem. Rep.Congo, Rep.Costa RicaCote d'IvoireCroatiaCubaCyprusCzech RepublicDenmarkDjiboutiDominicaDominican RepublicEarly-demographic dividendEast Asia & PacificEast Asia & Pacific (excluding high income)East Asia & Pacific (IDA & IBRD countries)EcuadorEgypt, Arab Rep.El SalvadorEquatorial GuineaEritreaEstoniaEthiopiaEuro areaEurope & Central AsiaEurope & Central Asia (excluding high income)Europe & Central Asia (IDA & IBRD countries)European UnionFijiFinlandFragile and conflict affected situationsFranceGabonGambia, TheGeorgiaGermanyGhanaGreeceGrenadaGuatemalaGuineaGuinea-BissauGuyanaHaitiHeavily indebted poor countries (HIPC)High incomeHondurasHong Kong SAR, ChinaHungaryIBRD onlyIcelandIDA & IBRD totalIDA blendIDA onlyIDA totalIndiaIndonesiaIran, Islamic Rep.IraqIrelandItalyJamaicaJapanJordanKazakhstanKenyaKiribatiKorea, Rep.KosovoKuwaitKyrgyz RepublicLao PDRLate-demographic dividendLatin America & Caribbean Latin America & Caribbean (excluding high income)Latin America & the Caribbean (IDA & IBRD countries)LatviaLeast developed countries: UN classificationLebanonLesothoLiberiaLithuaniaLow & middle incomeLow incomeLower middle incomeLuxembourgMacedonia, FYRMadagascarMalawiMalaysiaMaldivesMaliMarshall IslandsMauritaniaMauritiusMexicoMicronesia, Fed. Sts.Middle East & North AfricaMiddle East & North Africa (excluding high income)Middle East & North Africa (IDA & IBRD countries)Middle incomeMoldovaMongoliaMontenegroMoroccoMozambiqueMyanmarNamibiaNepalNetherlandsNew ZealandNicaraguaNigerNigeriaNorth AmericaNorwayOECD membersOmanOther small statesPacific island small statesPakistanPalauPanamaPapua New GuineaParaguayPeruPhilippinesPolandPortugalPost-demographic dividendPre-demographic dividendPuerto RicoQatarRomaniaRussian FederationRwandaSamoaSao Tome and PrincipeSaudi ArabiaSenegalSerbiaSeychellesSierra LeoneSingaporeSlovak RepublicSloveniaSmall statesSolomon IslandsSomaliaSouth AfricaSouth AsiaSouth Asia (IDA & IBRD)SpainSri LankaSt. Kitts and NevisSt. LuciaSt. Vincent and the GrenadinesSub-Saharan Africa Sub-Saharan Africa (excluding high income)Sub-Saharan Africa (IDA & IBRD countries)SudanSurinameSwazilandSwedenSwitzerlandSyrian Arab RepublicTajikistanTanzaniaThailandTimor-LesteTogoTongaTrinidad and TobagoTunisiaTurkeyTurkmenistanTuvaluUgandaUkraineUnited Arab EmiratesUnited KingdomUnited StatesUpper middle incomeUruguayUzbekistanVanuatuVenezuela, RBVietnamWest Bank and GazaWorldZambiaZimbabwe Timeline:
This timeline shows a graph from 1987 to 2016 of Tajikistan. No data until 1986. Number of actual observations by date: 30.
Source name:
World Development Indicators
Source organization:
World Bank national accounts data, and OECD National Accounts data files.
Categories, topics:
Economy & Growth
Last updated:
apr 23, 2017
Indicators value changes by year
Minimum:
-28.53
jan 1, 1993
At the date of observation
Value
Absolute change
Change from previous value
jan 1, 1988
2.3
-1.7
-42.5%
jan 1, 1989
14.8
+12.5
543.48%
jan 1, 1990
2.3
-12.5
-84.46%
jan 1, 1991
1.3
-1.0
-43.48%
jan 1, 1992
-7.342
-8.642
-664.75%
jan 1, 1993
-28.53
-21.188
288.59%
jan 1, 1994
-10.06
+18.469
-64.74%
jan 1, 1995
-25.985
-15.924
158.29%
jan 1, 1996
-13.571
+12.414
-47.77%
jan 1, 1997
-21.935
-8.364
61.63%
jan 1, 1998
-1.854
+20.081
-91.55%
jan 1, 1999
7.273
+9.127
-492.25%
jan 1, 2000
5.404
-1.869
-25.69%
jan 1, 2001
9.739
+4.335
80.21%
jan 1, 2002
14.695
+4.956
50.89%
jan 1, 2003
10.571
-4.124
-28.07%
jan 1, 2004
9.335
-1.235
-11.69%
jan 1, 2005
2.8
-6.535
-70.01%
jan 1, 2006
6.777
+3.977
142.03%
jan 1, 2007
4.31
-2.467
-36.4%
jan 1, 2008
-7.669
-11.978
-277.94%
jan 1, 2009
-7.121
+0.547
-7.14%
jan 1, 2010
-7.112
+0.009
-0.13%
jan 1, 2011
-2.407
+4.704
-66.15%
jan 1, 2012
5.777
+8.184
-339.97%
jan 1, 2013
7.696
+1.919
33.22%
jan 1, 2014
8.821
+1.125
14.62%
jan 1, 2015
5.077
-3.744
-42.44%
jan 1, 2016
11.2
+6.123
120.59%
Ranking of countries by current statistics by years


Comments: