29
/
en
AIzaSyAYiBZKx7MnpbEhh9jyipgxe19OcubqV5w
April 1, 2024
40009
IDA total
IDA
false
2
1
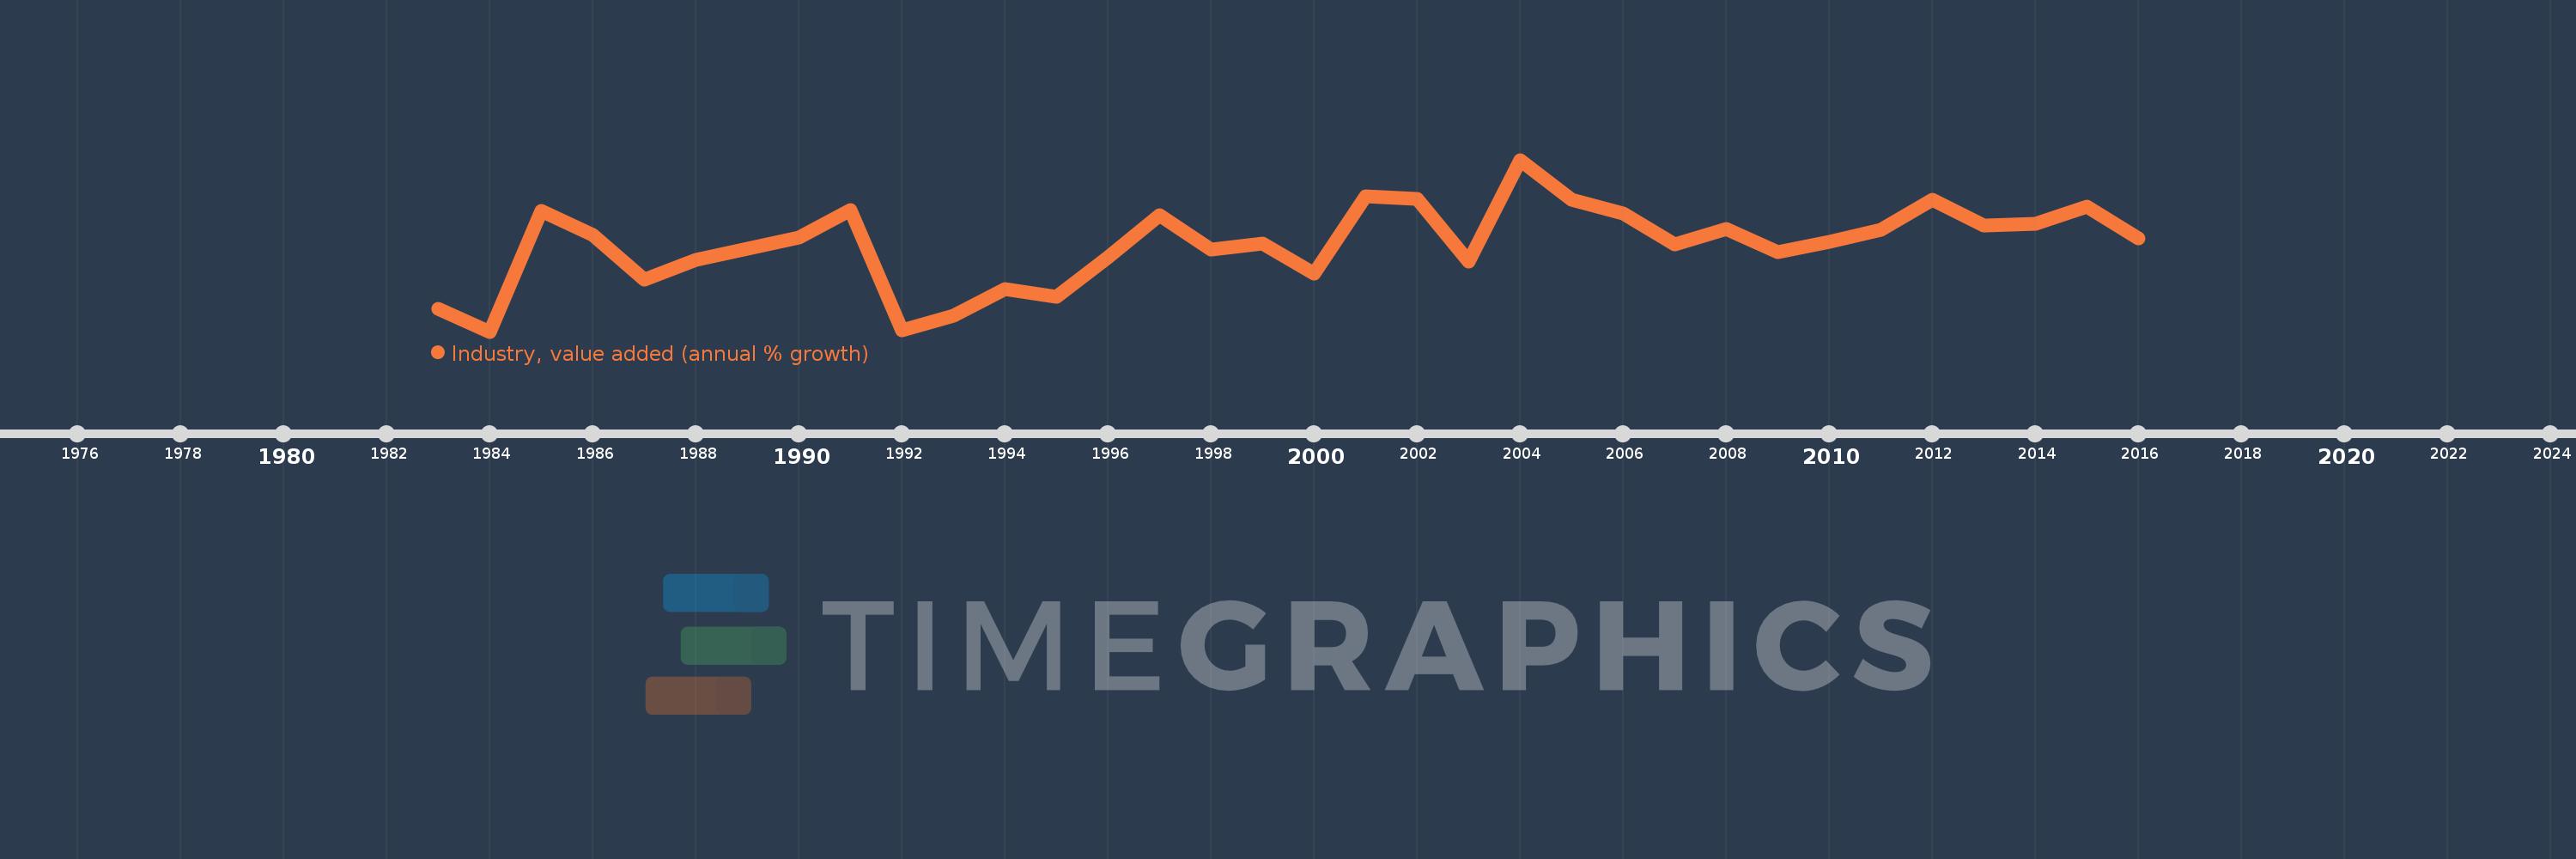
Industry, value added (annual % growth)
2016,2015,2014,2013,2012,2011,2010,2009,2008,2007,2006,2005,2004,2003,2002,2001,2000,1999,1998,1997,1996,1995,1994,1993,1992,1991,1990,1989,1988,1987,1986,1985,1984,1983
This statistics in other country:
AfghanistanAlbaniaAlgeriaAntigua and BarbudaArab WorldArgentinaArmeniaAustraliaAustriaAzerbaijanBahamas, TheBahrainBangladeshBelarusBelgiumBelizeBeninBermudaBhutanBoliviaBosnia and HerzegovinaBotswanaBrazilBrunei DarussalamBulgariaBurkina FasoBurundiCabo VerdeCambodiaCameroonCanadaCaribbean small statesCayman IslandsCentral African RepublicCentral Europe and the BalticsChadChileChinaColombiaComorosCongo, Dem. Rep.Congo, Rep.Costa RicaCote d'IvoireCroatiaCubaCyprusCzech RepublicDenmarkDjiboutiDominicaDominican RepublicEarly-demographic dividendEast Asia & PacificEast Asia & Pacific (excluding high income)East Asia & Pacific (IDA & IBRD countries)EcuadorEgypt, Arab Rep.El SalvadorEquatorial GuineaEritreaEstoniaEthiopiaEuro areaEurope & Central AsiaEurope & Central Asia (excluding high income)Europe & Central Asia (IDA & IBRD countries)European UnionFijiFinlandFragile and conflict affected situationsFranceGabonGambia, TheGeorgiaGermanyGhanaGreeceGrenadaGuatemalaGuineaGuinea-BissauGuyanaHaitiHeavily indebted poor countries (HIPC)High incomeHondurasHong Kong SAR, ChinaHungaryIBRD onlyIcelandIDA & IBRD totalIDA blendIDA onlyIDA totalIndiaIndonesiaIran, Islamic Rep.IraqIrelandItalyJamaicaJapanJordanKazakhstanKenyaKiribatiKorea, Rep.KosovoKuwaitKyrgyz RepublicLao PDRLate-demographic dividendLatin America & Caribbean Latin America & Caribbean (excluding high income)Latin America & the Caribbean (IDA & IBRD countries)LatviaLeast developed countries: UN classificationLebanonLesothoLiberiaLithuaniaLow & middle incomeLow incomeLower middle incomeLuxembourgMacedonia, FYRMadagascarMalawiMalaysiaMaldivesMaliMarshall IslandsMauritaniaMauritiusMexicoMicronesia, Fed. Sts.Middle East & North AfricaMiddle East & North Africa (excluding high income)Middle East & North Africa (IDA & IBRD countries)Middle incomeMoldovaMongoliaMontenegroMoroccoMozambiqueMyanmarNamibiaNepalNetherlandsNew ZealandNicaraguaNigerNigeriaNorth AmericaNorwayOECD membersOmanOther small statesPacific island small statesPakistanPalauPanamaPapua New GuineaParaguayPeruPhilippinesPolandPortugalPost-demographic dividendPre-demographic dividendPuerto RicoQatarRomaniaRussian FederationRwandaSamoaSao Tome and PrincipeSaudi ArabiaSenegalSerbiaSeychellesSierra LeoneSingaporeSlovak RepublicSloveniaSmall statesSolomon IslandsSomaliaSouth AfricaSouth AsiaSouth Asia (IDA & IBRD)SpainSri LankaSt. Kitts and NevisSt. LuciaSt. Vincent and the GrenadinesSub-Saharan Africa Sub-Saharan Africa (excluding high income)Sub-Saharan Africa (IDA & IBRD countries)SudanSurinameSwazilandSwedenSwitzerlandSyrian Arab RepublicTajikistanTanzaniaThailandTimor-LesteTogoTongaTrinidad and TobagoTunisiaTurkeyTurkmenistanTuvaluUgandaUkraineUnited Arab EmiratesUnited KingdomUnited StatesUpper middle incomeUruguayUzbekistanVanuatuVenezuela, RBVietnamWest Bank and GazaWorldZambiaZimbabwe Timeline:
This timeline shows a graph from 1983 to 2016 of IDA total. No data until 1982. Number of actual observations by date: 34.
Source name:
World Development Indicators
Source organization:
World Bank national accounts data, and OECD National Accounts data files.
Categories, topics:
Economy & Growth
Last updated:
apr 23, 2017
Indicators value changes by year
Minimum:
-2.314
jan 1, 1984
Maximum:
10.057
jan 1, 2004
At the date of observation
Value
Absolute change
Change from previous value
jan 1, 1983
-0.662
-0.662
0.0%
jan 1, 1984
-2.314
-1.652
249.45%
jan 1, 1985
6.346
+8.66
-374.18%
jan 1, 1986
4.672
-1.674
-26.38%
jan 1, 1987
1.432
-3.239
-69.34%
jan 1, 1988
2.858
+1.425
99.49%
jan 1, 1989
3.661
+0.804
28.12%
jan 1, 1990
4.443
+0.781
21.34%
jan 1, 1991
6.463
+2.021
45.48%
jan 1, 1992
-2.251
-8.715
-134.83%
jan 1, 1993
-1.147
+1.105
-49.07%
jan 1, 1994
0.73
+1.877
-163.7%
jan 1, 1995
0.188
-0.542
-74.2%
jan 1, 1996
3.02
+2.832
1.5K%
jan 1, 1997
6.092
+3.071
101.69%
jan 1, 1998
3.613
-2.479
-40.69%
jan 1, 1999
4.007
+0.394
10.9%
jan 1, 2000
1.846
-2.161
-53.92%
jan 1, 2001
7.448
+5.602
303.41%
jan 1, 2002
7.216
-0.232
-3.11%
jan 1, 2003
2.743
-4.474
-62.0%
jan 1, 2004
10.057
+7.314
266.7%
jan 1, 2005
7.208
-2.849
-28.33%
jan 1, 2006
6.215
-0.993
-13.77%
jan 1, 2007
3.95
-2.265
-36.45%
jan 1, 2008
5.087
+1.138
28.81%
jan 1, 2009
3.401
-1.687
-33.15%
jan 1, 2010
4.151
+0.75
22.06%
jan 1, 2011
5.035
+0.884
21.29%
jan 1, 2012
7.168
+2.134
42.38%
jan 1, 2013
5.323
-1.845
-25.74%
jan 1, 2014
5.426
+0.103
1.93%
jan 1, 2015
6.661
+1.234
22.75%
jan 1, 2016
4.414
-2.247
-33.73%
Ranking of countries by current statistics by years


Comments: