29
/
en
AIzaSyAYiBZKx7MnpbEhh9jyipgxe19OcubqV5w
April 1, 2024
93714
Bulgaria
BGR
true
2
1
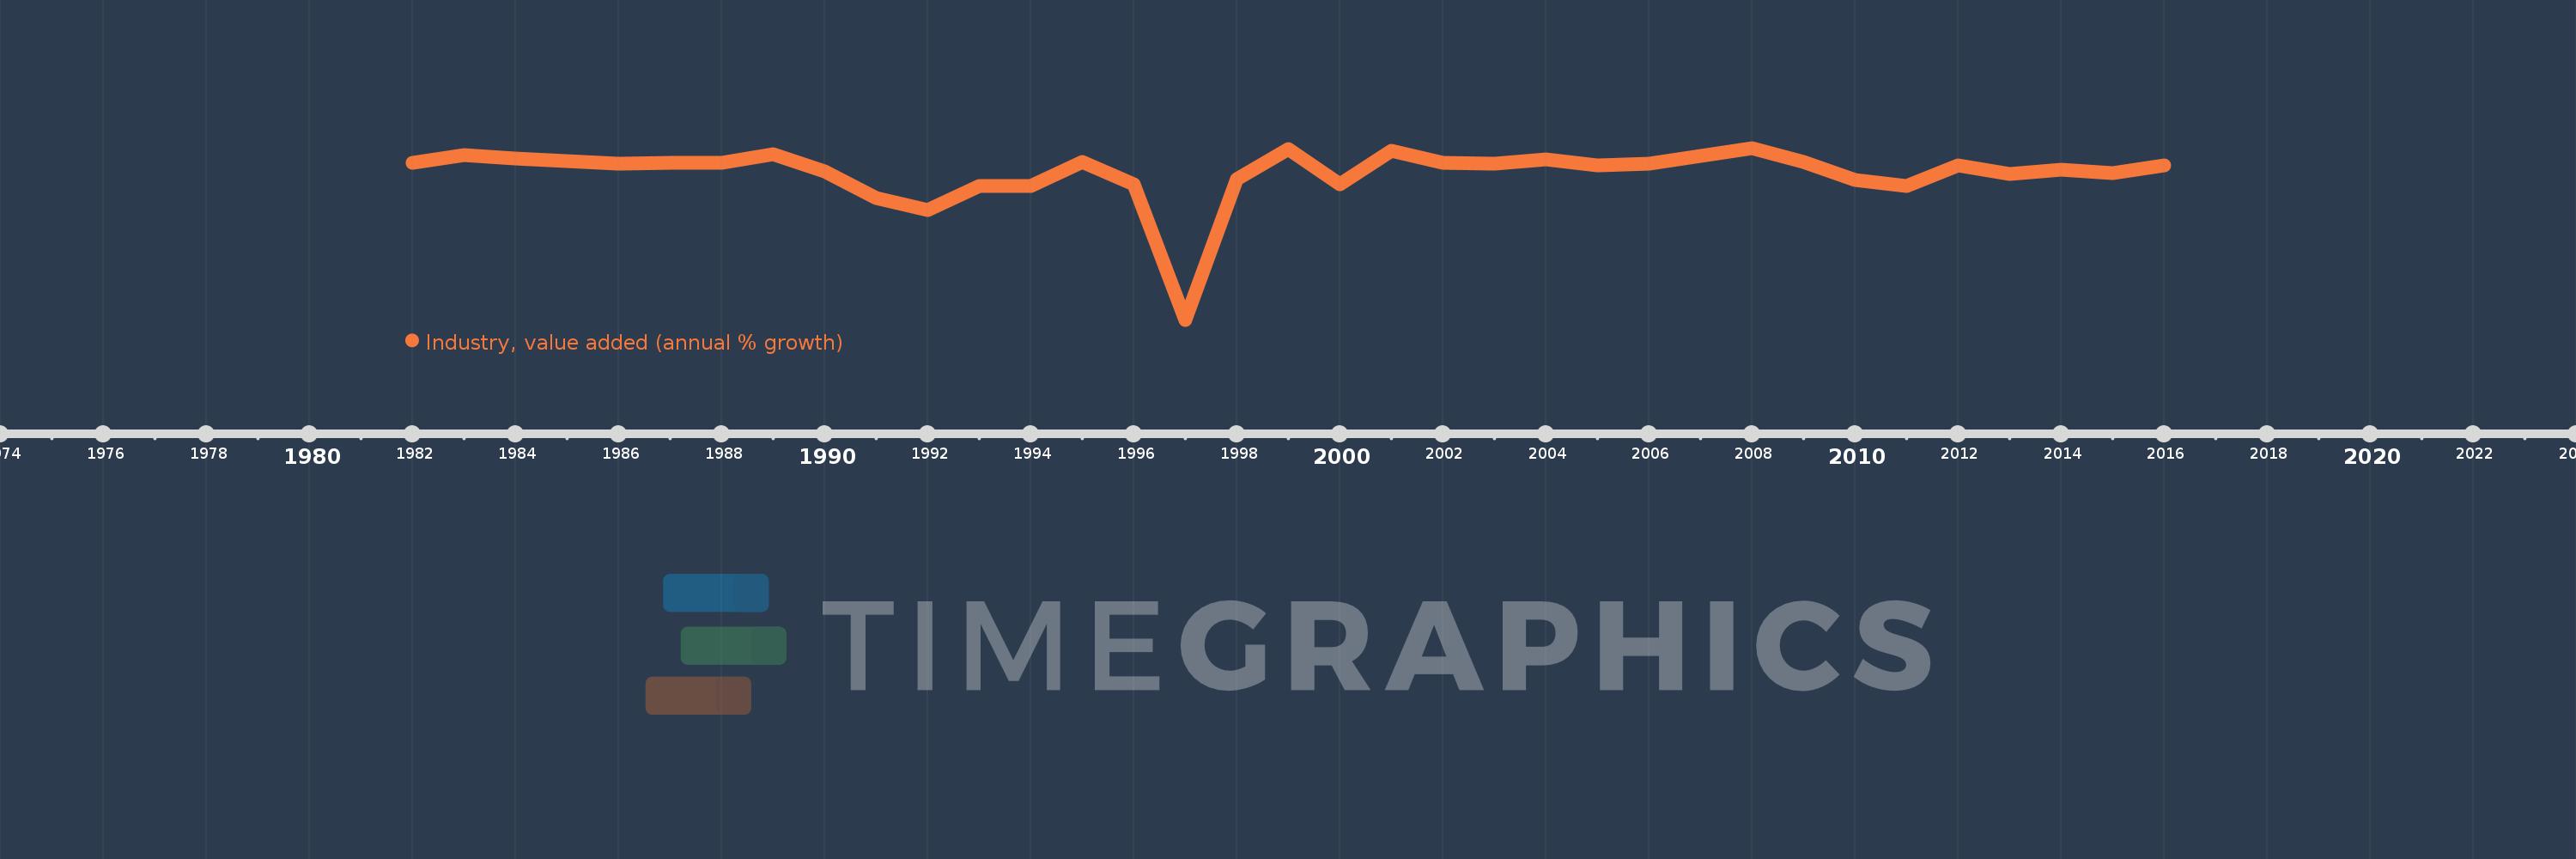
Industry, value added (annual % growth)
2016,2015,2014,2013,2012,2011,2010,2009,2008,2007,2006,2005,2004,2003,2002,2001,2000,1999,1998,1997,1996,1995,1994,1993,1992,1991,1990,1989,1988,1987,1986,1985,1984,1983,1982
This statistics in other country:
AfghanistanAlbaniaAlgeriaAntigua and BarbudaArab WorldArgentinaArmeniaAustraliaAustriaAzerbaijanBahamas, TheBahrainBangladeshBelarusBelgiumBelizeBeninBermudaBhutanBoliviaBosnia and HerzegovinaBotswanaBrazilBrunei DarussalamBulgariaBurkina FasoBurundiCabo VerdeCambodiaCameroonCanadaCaribbean small statesCayman IslandsCentral African RepublicCentral Europe and the BalticsChadChileChinaColombiaComorosCongo, Dem. Rep.Congo, Rep.Costa RicaCote d'IvoireCroatiaCubaCyprusCzech RepublicDenmarkDjiboutiDominicaDominican RepublicEarly-demographic dividendEast Asia & PacificEast Asia & Pacific (excluding high income)East Asia & Pacific (IDA & IBRD countries)EcuadorEgypt, Arab Rep.El SalvadorEquatorial GuineaEritreaEstoniaEthiopiaEuro areaEurope & Central AsiaEurope & Central Asia (excluding high income)Europe & Central Asia (IDA & IBRD countries)European UnionFijiFinlandFragile and conflict affected situationsFranceGabonGambia, TheGeorgiaGermanyGhanaGreeceGrenadaGuatemalaGuineaGuinea-BissauGuyanaHaitiHeavily indebted poor countries (HIPC)High incomeHondurasHong Kong SAR, ChinaHungaryIBRD onlyIcelandIDA & IBRD totalIDA blendIDA onlyIDA totalIndiaIndonesiaIran, Islamic Rep.IraqIrelandItalyJamaicaJapanJordanKazakhstanKenyaKiribatiKorea, Rep.KosovoKuwaitKyrgyz RepublicLao PDRLate-demographic dividendLatin America & Caribbean Latin America & Caribbean (excluding high income)Latin America & the Caribbean (IDA & IBRD countries)LatviaLeast developed countries: UN classificationLebanonLesothoLiberiaLithuaniaLow & middle incomeLow incomeLower middle incomeLuxembourgMacedonia, FYRMadagascarMalawiMalaysiaMaldivesMaliMarshall IslandsMauritaniaMauritiusMexicoMicronesia, Fed. Sts.Middle East & North AfricaMiddle East & North Africa (excluding high income)Middle East & North Africa (IDA & IBRD countries)Middle incomeMoldovaMongoliaMontenegroMoroccoMozambiqueMyanmarNamibiaNepalNetherlandsNew ZealandNicaraguaNigerNigeriaNorth AmericaNorwayOECD membersOmanOther small statesPacific island small statesPakistanPalauPanamaPapua New GuineaParaguayPeruPhilippinesPolandPortugalPost-demographic dividendPre-demographic dividendPuerto RicoQatarRomaniaRussian FederationRwandaSamoaSao Tome and PrincipeSaudi ArabiaSenegalSerbiaSeychellesSierra LeoneSingaporeSlovak RepublicSloveniaSmall statesSolomon IslandsSomaliaSouth AfricaSouth AsiaSouth Asia (IDA & IBRD)SpainSri LankaSt. Kitts and NevisSt. LuciaSt. Vincent and the GrenadinesSub-Saharan Africa Sub-Saharan Africa (excluding high income)Sub-Saharan Africa (IDA & IBRD countries)SudanSurinameSwazilandSwedenSwitzerlandSyrian Arab RepublicTajikistanTanzaniaThailandTimor-LesteTogoTongaTrinidad and TobagoTunisiaTurkeyTurkmenistanTuvaluUgandaUkraineUnited Arab EmiratesUnited KingdomUnited StatesUpper middle incomeUruguayUzbekistanVanuatuVenezuela, RBVietnamWest Bank and GazaWorldZambiaZimbabwe Timeline:
This timeline shows a graph from 1982 to 2016 of Bulgaria. No data until 1981. Number of actual observations by date: 35.
Source name:
World Development Indicators
Source organization:
World Bank national accounts data, and OECD National Accounts data files.
Categories, topics:
Economy & Growth
Last updated:
apr 23, 2017
Indicators value changes by year
Minimum:
-73.661
jan 1, 1997
Maximum:
12.873
jan 1, 2008
At the date of observation
Value
Absolute change
Change from previous value
jan 1, 1982
5.468
+5.468
0.0%
jan 1, 1983
9.347
+3.879
70.94%
jan 1, 1984
7.639
-1.707
-18.27%
jan 1, 1985
6.131
-1.508
-19.74%
jan 1, 1986
5.094
-1.037
-16.92%
jan 1, 1987
5.193
+0.099
1.94%
jan 1, 1988
5.374
+0.181
3.48%
jan 1, 1989
9.914
+4.54
84.49%
jan 1, 1990
0.965
-8.949
-90.26%
jan 1, 1991
-12.5
-13.465
-1.4K%
jan 1, 1992
-18.6
-6.1
48.8%
jan 1, 1993
-6.4
+12.2
-65.59%
jan 1, 1994
-6.2
+0.2
-3.13%
jan 1, 1995
6.0
+12.2
-196.77%
jan 1, 1996
-5.4
-11.4
-190.0%
jan 1, 1997
-73.661
-68.261
1.26K%
jan 1, 1998
-2.84
+70.821
-96.14%
jan 1, 1999
12.241
+15.08
-531.05%
jan 1, 2000
-5.4
-17.641
-144.12%
jan 1, 2001
11.33
+16.73
-309.82%
jan 1, 2002
5.273
-6.057
-53.46%
jan 1, 2003
4.901
-0.371
-7.04%
jan 1, 2004
7.146
+2.245
45.8%
jan 1, 2005
4.07
-3.076
-43.05%
jan 1, 2006
5.157
+1.087
26.71%
jan 1, 2007
8.983
+3.826
74.18%
jan 1, 2008
12.873
+3.891
43.31%
jan 1, 2009
5.665
-7.208
-55.99%
jan 1, 2010
-3.449
-9.115
-160.89%
jan 1, 2011
-6.127
-2.677
77.61%
jan 1, 2012
4.09
+10.217
-166.77%
jan 1, 2013
-0.286
-4.376
-106.98%
jan 1, 2014
1.985
+2.271
-794.92%
jan 1, 2015
0.337
-1.649
-83.05%
jan 1, 2016
4.159
+3.823
1.14K%
Ranking of countries by current statistics by years


Comments: