29
/
en
AIzaSyAYiBZKx7MnpbEhh9jyipgxe19OcubqV5w
April 1, 2024
235923
Senegal
SEN
true
2
1
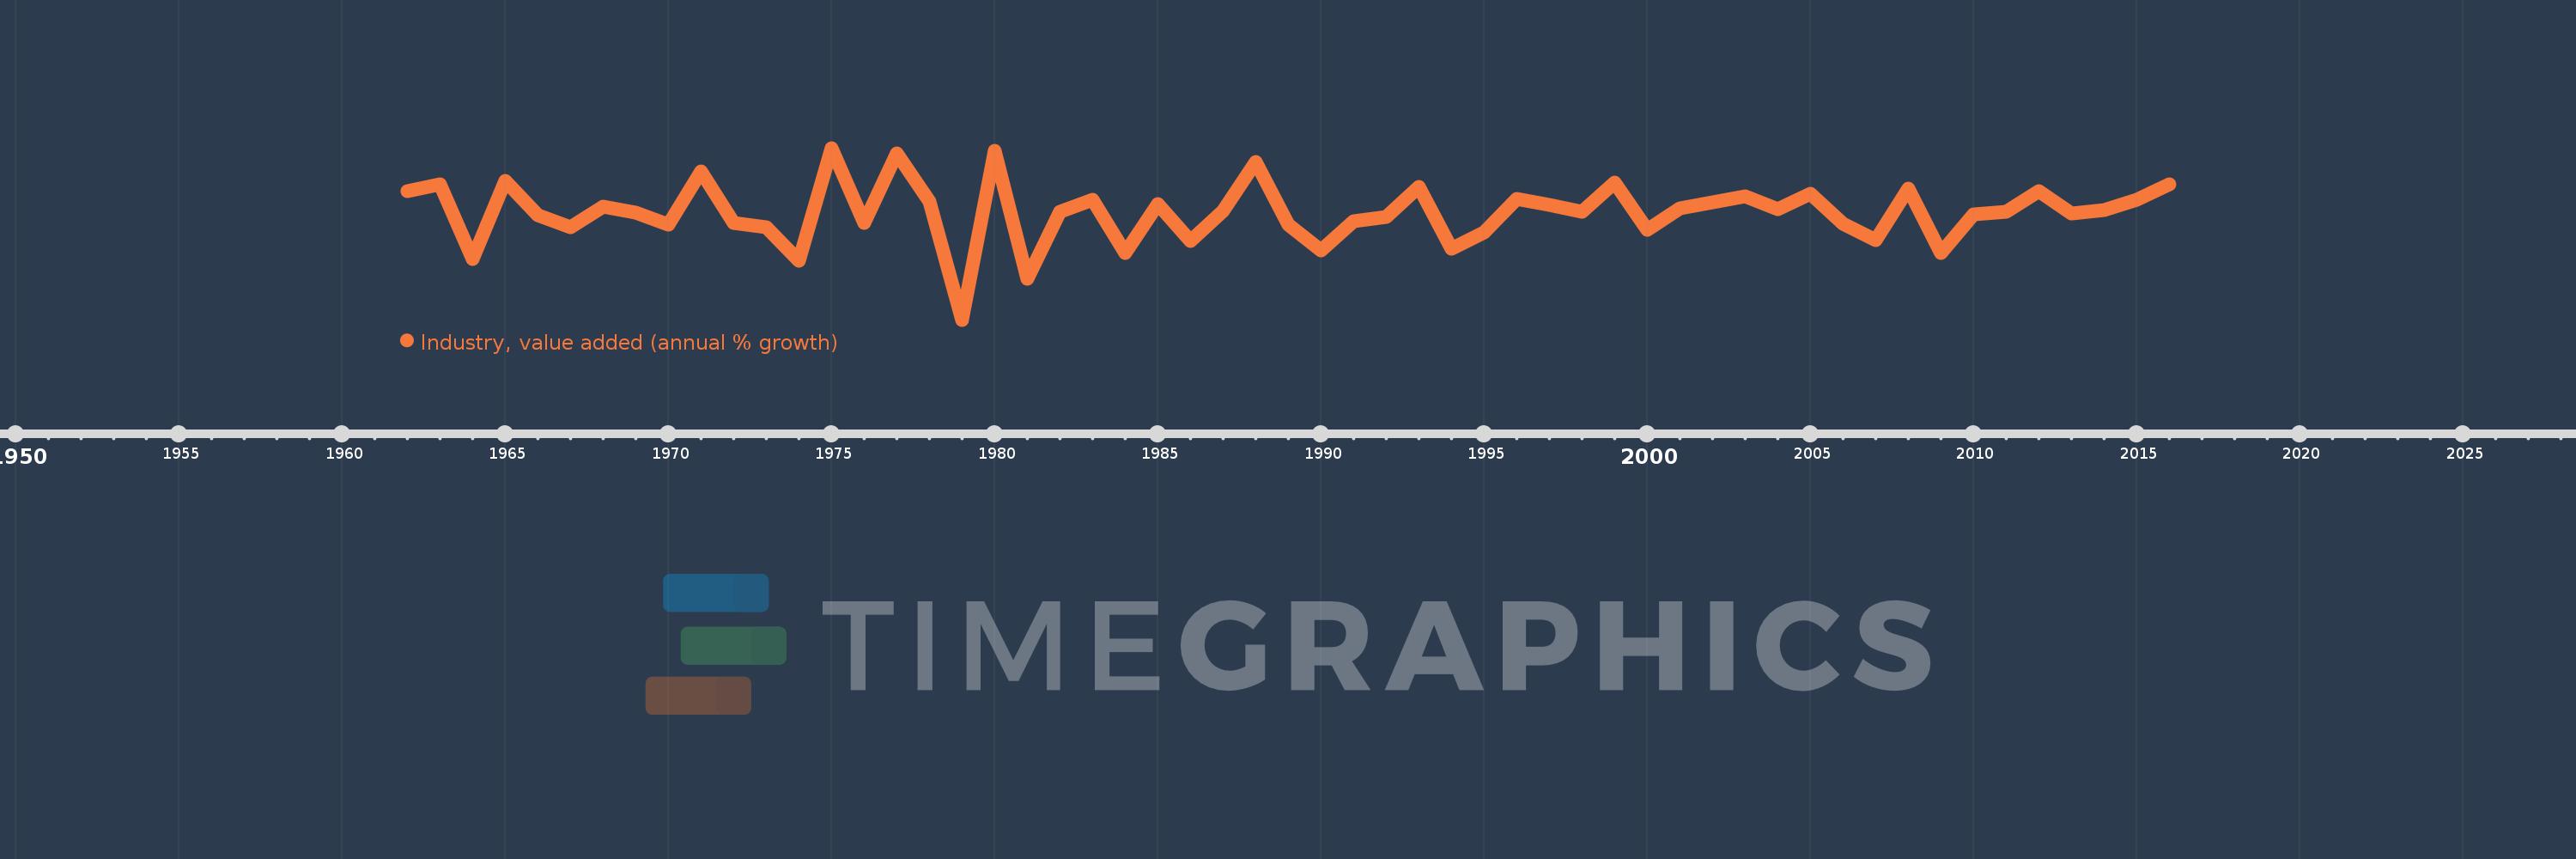
Industry, value added (annual % growth)
2016,2015,2014,2013,2012,2011,2010,2009,2008,2007,2006,2005,2004,2003,2002,2001,2000,1999,1998,1997,1996,1995,1994,1993,1992,1991,1990,1989,1988,1987,1986,1985,1984,1983,1982,1981,1980,1979,1978,1977,1976,1975,1974,1973,1972,1971,1970,1969,1968,1967,1966,1965,1964,1963,1962
This statistics in other country:
AfghanistanAlbaniaAlgeriaAntigua and BarbudaArab WorldArgentinaArmeniaAustraliaAustriaAzerbaijanBahamas, TheBahrainBangladeshBelarusBelgiumBelizeBeninBermudaBhutanBoliviaBosnia and HerzegovinaBotswanaBrazilBrunei DarussalamBulgariaBurkina FasoBurundiCabo VerdeCambodiaCameroonCanadaCaribbean small statesCayman IslandsCentral African RepublicCentral Europe and the BalticsChadChileChinaColombiaComorosCongo, Dem. Rep.Congo, Rep.Costa RicaCote d'IvoireCroatiaCubaCyprusCzech RepublicDenmarkDjiboutiDominicaDominican RepublicEarly-demographic dividendEast Asia & PacificEast Asia & Pacific (excluding high income)East Asia & Pacific (IDA & IBRD countries)EcuadorEgypt, Arab Rep.El SalvadorEquatorial GuineaEritreaEstoniaEthiopiaEuro areaEurope & Central AsiaEurope & Central Asia (excluding high income)Europe & Central Asia (IDA & IBRD countries)European UnionFijiFinlandFragile and conflict affected situationsFranceGabonGambia, TheGeorgiaGermanyGhanaGreeceGrenadaGuatemalaGuineaGuinea-BissauGuyanaHaitiHeavily indebted poor countries (HIPC)High incomeHondurasHong Kong SAR, ChinaHungaryIBRD onlyIcelandIDA & IBRD totalIDA blendIDA onlyIDA totalIndiaIndonesiaIran, Islamic Rep.IraqIrelandItalyJamaicaJapanJordanKazakhstanKenyaKiribatiKorea, Rep.KosovoKuwaitKyrgyz RepublicLao PDRLate-demographic dividendLatin America & Caribbean Latin America & Caribbean (excluding high income)Latin America & the Caribbean (IDA & IBRD countries)LatviaLeast developed countries: UN classificationLebanonLesothoLiberiaLithuaniaLow & middle incomeLow incomeLower middle incomeLuxembourgMacedonia, FYRMadagascarMalawiMalaysiaMaldivesMaliMarshall IslandsMauritaniaMauritiusMexicoMicronesia, Fed. Sts.Middle East & North AfricaMiddle East & North Africa (excluding high income)Middle East & North Africa (IDA & IBRD countries)Middle incomeMoldovaMongoliaMontenegroMoroccoMozambiqueMyanmarNamibiaNepalNetherlandsNew ZealandNicaraguaNigerNigeriaNorth AmericaNorwayOECD membersOmanOther small statesPacific island small statesPakistanPalauPanamaPapua New GuineaParaguayPeruPhilippinesPolandPortugalPost-demographic dividendPre-demographic dividendPuerto RicoQatarRomaniaRussian FederationRwandaSamoaSao Tome and PrincipeSaudi ArabiaSenegalSerbiaSeychellesSierra LeoneSingaporeSlovak RepublicSloveniaSmall statesSolomon IslandsSomaliaSouth AfricaSouth AsiaSouth Asia (IDA & IBRD)SpainSri LankaSt. Kitts and NevisSt. LuciaSt. Vincent and the GrenadinesSub-Saharan Africa Sub-Saharan Africa (excluding high income)Sub-Saharan Africa (IDA & IBRD countries)SudanSurinameSwazilandSwedenSwitzerlandSyrian Arab RepublicTajikistanTanzaniaThailandTimor-LesteTogoTongaTrinidad and TobagoTunisiaTurkeyTurkmenistanTuvaluUgandaUkraineUnited Arab EmiratesUnited KingdomUnited StatesUpper middle incomeUruguayUzbekistanVanuatuVenezuela, RBVietnamWest Bank and GazaWorldZambiaZimbabwe Timeline:
This timeline shows a graph from 1962 to 2016 of Senegal. No data until 1961. Number of actual observations by date: 55.
Source name:
World Development Indicators
Source organization:
World Bank national accounts data, and OECD National Accounts data files.
Categories, topics:
Economy & Growth
Last updated:
apr 23, 2017
Indicators value changes by year
Minimum:
-8.994
jan 1, 1979
At the date of observation
Value
Absolute change
Change from previous value
jan 1, 1962
6.296
+6.296
0.0%
jan 1, 1963
7.16
+0.864
13.72%
jan 1, 1964
-1.725
-8.885
-124.09%
jan 1, 1965
7.513
+9.238
-535.6%
jan 1, 1966
3.46
-4.054
-53.95%
jan 1, 1967
2.062
-1.398
-40.41%
jan 1, 1968
4.5
+2.438
118.23%
jan 1, 1969
3.779
-0.721
-16.02%
jan 1, 1970
2.286
-1.492
-39.5%
jan 1, 1971
8.609
+6.323
276.58%
jan 1, 1972
2.515
-6.094
-70.78%
jan 1, 1973
2.007
-0.508
-20.19%
jan 1, 1974
-1.968
-3.975
-198.03%
jan 1, 1975
11.45
+13.418
-681.82%
jan 1, 1976
2.535
-8.915
-77.86%
jan 1, 1977
10.8
+8.265
326.04%
jan 1, 1978
5.109
-5.692
-52.7%
jan 1, 1979
-8.994
-14.103
-276.06%
jan 1, 1980
11.075
+20.07
-223.14%
jan 1, 1981
-4.076
-15.151
-136.8%
jan 1, 1982
3.843
+7.919
-194.3%
jan 1, 1983
5.24
+1.397
36.35%
jan 1, 1984
-1.074
-6.315
-120.5%
jan 1, 1985
4.727
+5.801
-539.93%
jan 1, 1986
0.393
-4.334
-91.68%
jan 1, 1987
3.917
+3.524
896.37%
jan 1, 1988
9.797
+5.88
150.13%
jan 1, 1989
2.34
-7.457
-76.12%
jan 1, 1990
-0.766
-3.106
-132.73%
jan 1, 1991
2.694
+3.46
-451.83%
jan 1, 1992
3.271
+0.577
21.4%
jan 1, 1993
6.859
+3.588
109.7%
jan 1, 1994
-0.496
-7.355
-107.23%
jan 1, 1995
1.379
+1.875
-378.09%
jan 1, 1996
5.374
+3.995
289.76%
jan 1, 1997
4.677
-0.697
-12.97%
jan 1, 1998
3.862
-0.815
-17.43%
jan 1, 1999
7.34
+3.479
90.08%
jan 1, 2000
1.699
-5.641
-76.85%
jan 1, 2001
4.292
+2.592
152.56%
jan 1, 2002
5.003
+0.711
16.56%
jan 1, 2003
5.741
+0.738
14.75%
jan 1, 2004
4.2
-1.541
-26.84%
jan 1, 2005
6.008
+1.808
43.06%
jan 1, 2006
2.464
-3.544
-58.98%
jan 1, 2007
0.518
-1.946
-78.96%
jan 1, 2008
6.577
+6.058
1.17K%
jan 1, 2009
-1.063
-7.64
-116.17%
jan 1, 2010
3.531
+4.594
-432.08%
jan 1, 2011
3.847
+0.316
8.95%
jan 1, 2012
6.309
+2.462
64.0%
jan 1, 2013
3.606
-2.703
-42.85%
jan 1, 2014
4.021
+0.415
11.52%
jan 1, 2015
5.272
+1.251
31.12%
jan 1, 2016
7.135
+1.863
35.33%
Ranking of countries by current statistics by years


Comments: