29
/
en
AIzaSyAYiBZKx7MnpbEhh9jyipgxe19OcubqV5w
April 1, 2024
45188
Low & middle income
LMY
false
2
1
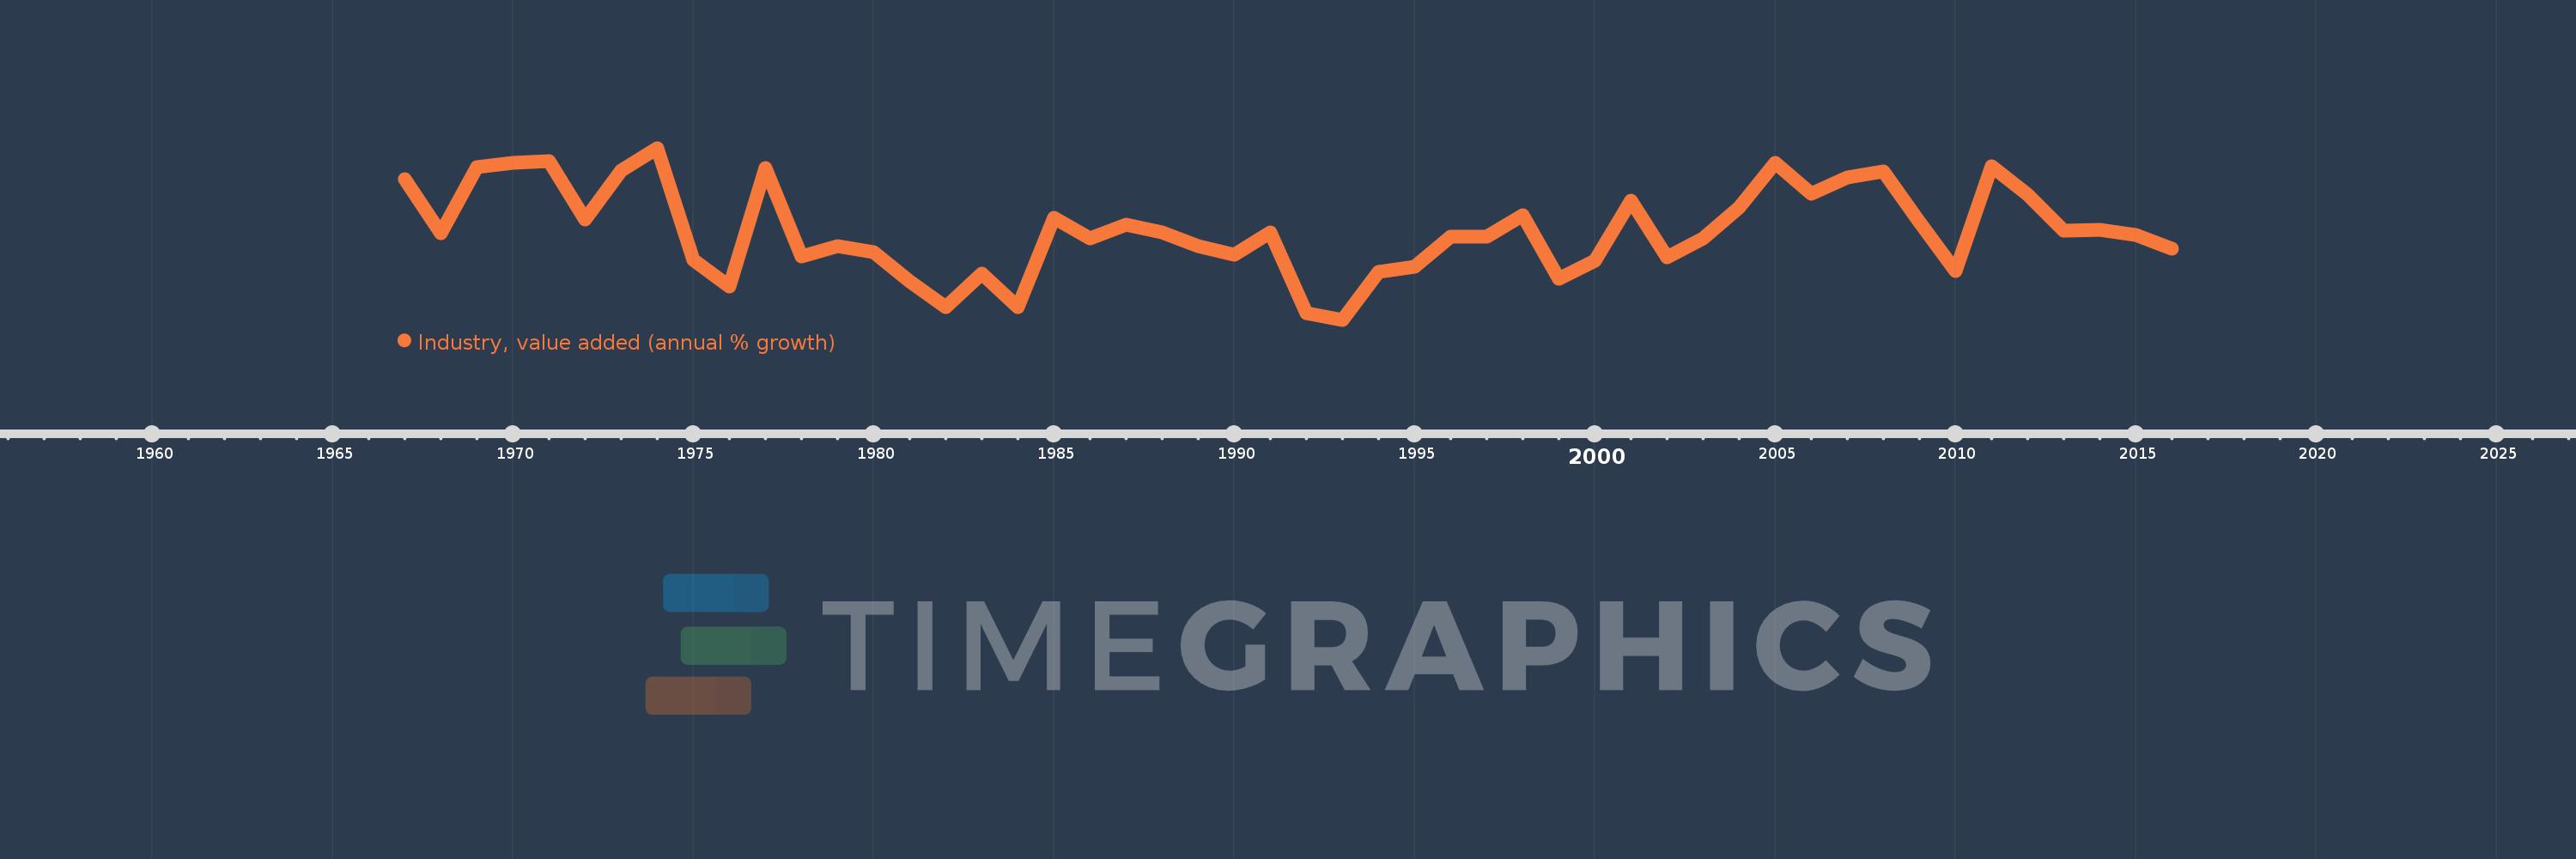
Industry, value added (annual % growth)
2016,2015,2014,2013,2012,2011,2010,2009,2008,2007,2006,2005,2004,2003,2002,2001,2000,1999,1998,1997,1996,1995,1994,1993,1992,1991,1990,1989,1988,1987,1986,1985,1984,1983,1982,1981,1980,1979,1978,1977,1976,1975,1974,1973,1972,1971,1970,1969,1968,1967
This statistics in other country:
AfghanistanAlbaniaAlgeriaAntigua and BarbudaArab WorldArgentinaArmeniaAustraliaAustriaAzerbaijanBahamas, TheBahrainBangladeshBelarusBelgiumBelizeBeninBermudaBhutanBoliviaBosnia and HerzegovinaBotswanaBrazilBrunei DarussalamBulgariaBurkina FasoBurundiCabo VerdeCambodiaCameroonCanadaCaribbean small statesCayman IslandsCentral African RepublicCentral Europe and the BalticsChadChileChinaColombiaComorosCongo, Dem. Rep.Congo, Rep.Costa RicaCote d'IvoireCroatiaCubaCyprusCzech RepublicDenmarkDjiboutiDominicaDominican RepublicEarly-demographic dividendEast Asia & PacificEast Asia & Pacific (excluding high income)East Asia & Pacific (IDA & IBRD countries)EcuadorEgypt, Arab Rep.El SalvadorEquatorial GuineaEritreaEstoniaEthiopiaEuro areaEurope & Central AsiaEurope & Central Asia (excluding high income)Europe & Central Asia (IDA & IBRD countries)European UnionFijiFinlandFragile and conflict affected situationsFranceGabonGambia, TheGeorgiaGermanyGhanaGreeceGrenadaGuatemalaGuineaGuinea-BissauGuyanaHaitiHeavily indebted poor countries (HIPC)High incomeHondurasHong Kong SAR, ChinaHungaryIBRD onlyIcelandIDA & IBRD totalIDA blendIDA onlyIDA totalIndiaIndonesiaIran, Islamic Rep.IraqIrelandItalyJamaicaJapanJordanKazakhstanKenyaKiribatiKorea, Rep.KosovoKuwaitKyrgyz RepublicLao PDRLate-demographic dividendLatin America & Caribbean Latin America & Caribbean (excluding high income)Latin America & the Caribbean (IDA & IBRD countries)LatviaLeast developed countries: UN classificationLebanonLesothoLiberiaLithuaniaLow & middle incomeLow incomeLower middle incomeLuxembourgMacedonia, FYRMadagascarMalawiMalaysiaMaldivesMaliMarshall IslandsMauritaniaMauritiusMexicoMicronesia, Fed. Sts.Middle East & North AfricaMiddle East & North Africa (excluding high income)Middle East & North Africa (IDA & IBRD countries)Middle incomeMoldovaMongoliaMontenegroMoroccoMozambiqueMyanmarNamibiaNepalNetherlandsNew ZealandNicaraguaNigerNigeriaNorth AmericaNorwayOECD membersOmanOther small statesPacific island small statesPakistanPalauPanamaPapua New GuineaParaguayPeruPhilippinesPolandPortugalPost-demographic dividendPre-demographic dividendPuerto RicoQatarRomaniaRussian FederationRwandaSamoaSao Tome and PrincipeSaudi ArabiaSenegalSerbiaSeychellesSierra LeoneSingaporeSlovak RepublicSloveniaSmall statesSolomon IslandsSomaliaSouth AfricaSouth AsiaSouth Asia (IDA & IBRD)SpainSri LankaSt. Kitts and NevisSt. LuciaSt. Vincent and the GrenadinesSub-Saharan Africa Sub-Saharan Africa (excluding high income)Sub-Saharan Africa (IDA & IBRD countries)SudanSurinameSwazilandSwedenSwitzerlandSyrian Arab RepublicTajikistanTanzaniaThailandTimor-LesteTogoTongaTrinidad and TobagoTunisiaTurkeyTurkmenistanTuvaluUgandaUkraineUnited Arab EmiratesUnited KingdomUnited StatesUpper middle incomeUruguayUzbekistanVanuatuVenezuela, RBVietnamWest Bank and GazaWorldZambiaZimbabwe Timeline:
This timeline shows a graph from 1967 to 2016 of Low & middle income. No data until 1966. Number of actual observations by date: 50.
Source name:
World Development Indicators
Source organization:
World Bank national accounts data, and OECD National Accounts data files.
Categories, topics:
Economy & Growth
Last updated:
apr 23, 2017
Indicators value changes by year
Minimum:
-0.705
jan 1, 1993
At the date of observation
Value
Absolute change
Change from previous value
jan 1, 1967
7.926
+7.926
0.0%
jan 1, 1968
4.62
-3.306
-41.71%
jan 1, 1969
8.67
+4.05
87.66%
jan 1, 1970
8.93
+0.261
3.0%
jan 1, 1971
9.014
+0.083
0.93%
jan 1, 1972
5.429
-3.585
-39.77%
jan 1, 1973
8.416
+2.987
55.01%
jan 1, 1974
9.826
+1.411
16.76%
jan 1, 1975
2.975
-6.851
-69.73%
jan 1, 1976
1.309
-1.666
-55.99%
jan 1, 1977
8.615
+7.306
558.05%
jan 1, 1978
3.165
-5.451
-63.27%
jan 1, 1979
3.832
+0.667
21.07%
jan 1, 1980
3.455
-0.376
-9.82%
jan 1, 1981
1.639
-1.816
-52.56%
jan 1, 1982
0.056
-1.583
-96.6%
jan 1, 1983
2.12
+2.064
3.7K%
jan 1, 1984
0.067
-2.053
-96.83%
jan 1, 1985
5.528
+5.461
8.12K%
jan 1, 1986
4.262
-1.266
-22.91%
jan 1, 1987
5.124
+0.862
20.23%
jan 1, 1988
4.649
-0.476
-9.28%
jan 1, 1989
3.83
-0.819
-17.62%
jan 1, 1990
3.269
-0.561
-14.64%
jan 1, 1991
4.637
+1.368
41.85%
jan 1, 1992
-0.324
-4.961
-107.0%
jan 1, 1993
-0.705
-0.381
117.45%
jan 1, 1994
2.218
+2.923
-414.35%
jan 1, 1995
2.519
+0.302
13.61%
jan 1, 1996
4.413
+1.894
75.16%
jan 1, 1997
4.401
-0.012
-0.27%
jan 1, 1998
5.71
+1.309
29.75%
jan 1, 1999
1.794
-3.917
-68.59%
jan 1, 2000
2.923
+1.129
62.97%
jan 1, 2001
6.612
+3.689
126.22%
jan 1, 2002
3.117
-3.495
-52.86%
jan 1, 2003
4.274
+1.157
37.11%
jan 1, 2004
6.184
+1.91
44.69%
jan 1, 2005
8.909
+2.725
44.06%
jan 1, 2006
7.035
-1.874
-21.03%
jan 1, 2007
8.043
+1.008
14.32%
jan 1, 2008
8.387
+0.345
4.29%
jan 1, 2009
5.274
-3.114
-37.12%
jan 1, 2010
2.276
-2.997
-56.84%
jan 1, 2011
8.726
+6.45
283.33%
jan 1, 2012
6.99
-1.736
-19.9%
jan 1, 2013
4.744
-2.246
-32.14%
jan 1, 2014
4.8
+0.057
1.2%
jan 1, 2015
4.491
-0.309
-6.44%
jan 1, 2016
3.671
-0.821
-18.27%
Ranking of countries by current statistics by years


Comments: