29
/
en
AIzaSyAYiBZKx7MnpbEhh9jyipgxe19OcubqV5w
April 1, 2024
42493
Latin America & Caribbean (excluding high income)
LAC
false
2
1
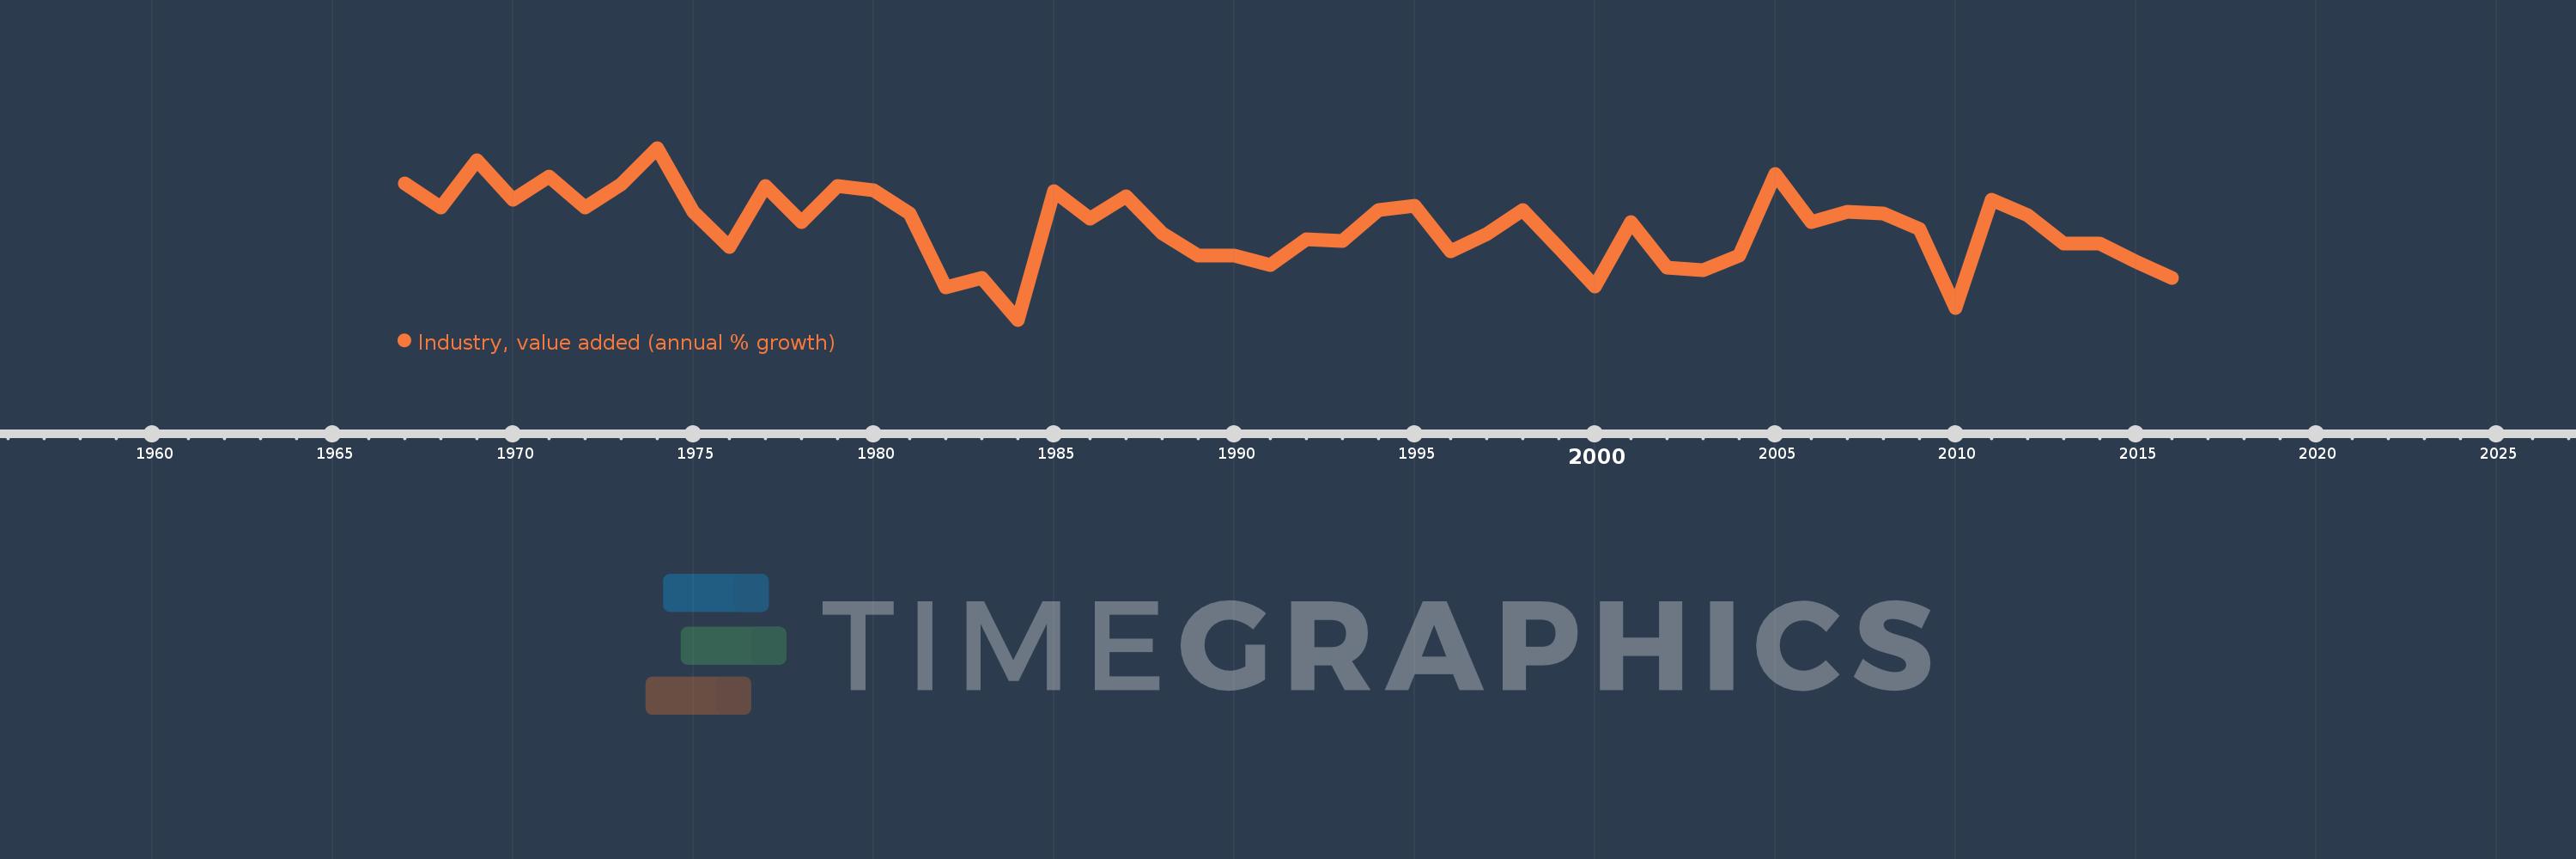
Industry, value added (annual % growth)
2016,2015,2014,2013,2012,2011,2010,2009,2008,2007,2006,2005,2004,2003,2002,2001,2000,1999,1998,1997,1996,1995,1994,1993,1992,1991,1990,1989,1988,1987,1986,1985,1984,1983,1982,1981,1980,1979,1978,1977,1976,1975,1974,1973,1972,1971,1970,1969,1968,1967
This statistics in other country:
AfghanistanAlbaniaAlgeriaAntigua and BarbudaArab WorldArgentinaArmeniaAustraliaAustriaAzerbaijanBahamas, TheBahrainBangladeshBelarusBelgiumBelizeBeninBermudaBhutanBoliviaBosnia and HerzegovinaBotswanaBrazilBrunei DarussalamBulgariaBurkina FasoBurundiCabo VerdeCambodiaCameroonCanadaCaribbean small statesCayman IslandsCentral African RepublicCentral Europe and the BalticsChadChileChinaColombiaComorosCongo, Dem. Rep.Congo, Rep.Costa RicaCote d'IvoireCroatiaCubaCyprusCzech RepublicDenmarkDjiboutiDominicaDominican RepublicEarly-demographic dividendEast Asia & PacificEast Asia & Pacific (excluding high income)East Asia & Pacific (IDA & IBRD countries)EcuadorEgypt, Arab Rep.El SalvadorEquatorial GuineaEritreaEstoniaEthiopiaEuro areaEurope & Central AsiaEurope & Central Asia (excluding high income)Europe & Central Asia (IDA & IBRD countries)European UnionFijiFinlandFragile and conflict affected situationsFranceGabonGambia, TheGeorgiaGermanyGhanaGreeceGrenadaGuatemalaGuineaGuinea-BissauGuyanaHaitiHeavily indebted poor countries (HIPC)High incomeHondurasHong Kong SAR, ChinaHungaryIBRD onlyIcelandIDA & IBRD totalIDA blendIDA onlyIDA totalIndiaIndonesiaIran, Islamic Rep.IraqIrelandItalyJamaicaJapanJordanKazakhstanKenyaKiribatiKorea, Rep.KosovoKuwaitKyrgyz RepublicLao PDRLate-demographic dividendLatin America & Caribbean Latin America & Caribbean (excluding high income)Latin America & the Caribbean (IDA & IBRD countries)LatviaLeast developed countries: UN classificationLebanonLesothoLiberiaLithuaniaLow & middle incomeLow incomeLower middle incomeLuxembourgMacedonia, FYRMadagascarMalawiMalaysiaMaldivesMaliMarshall IslandsMauritaniaMauritiusMexicoMicronesia, Fed. Sts.Middle East & North AfricaMiddle East & North Africa (excluding high income)Middle East & North Africa (IDA & IBRD countries)Middle incomeMoldovaMongoliaMontenegroMoroccoMozambiqueMyanmarNamibiaNepalNetherlandsNew ZealandNicaraguaNigerNigeriaNorth AmericaNorwayOECD membersOmanOther small statesPacific island small statesPakistanPalauPanamaPapua New GuineaParaguayPeruPhilippinesPolandPortugalPost-demographic dividendPre-demographic dividendPuerto RicoQatarRomaniaRussian FederationRwandaSamoaSao Tome and PrincipeSaudi ArabiaSenegalSerbiaSeychellesSierra LeoneSingaporeSlovak RepublicSloveniaSmall statesSolomon IslandsSomaliaSouth AfricaSouth AsiaSouth Asia (IDA & IBRD)SpainSri LankaSt. Kitts and NevisSt. LuciaSt. Vincent and the GrenadinesSub-Saharan Africa Sub-Saharan Africa (excluding high income)Sub-Saharan Africa (IDA & IBRD countries)SudanSurinameSwazilandSwedenSwitzerlandSyrian Arab RepublicTajikistanTanzaniaThailandTimor-LesteTogoTongaTrinidad and TobagoTunisiaTurkeyTurkmenistanTuvaluUgandaUkraineUnited Arab EmiratesUnited KingdomUnited StatesUpper middle incomeUruguayUzbekistanVanuatuVenezuela, RBVietnamWest Bank and GazaWorldZambiaZimbabwe Timeline:
This timeline shows a graph from 1967 to 2016 of Latin America & Caribbean (excluding high income). No data until 1966. Number of actual observations by date: 50.
Source name:
World Development Indicators
Source organization:
World Bank national accounts data, and OECD National Accounts data files.
Categories, topics:
Economy & Growth
Last updated:
apr 23, 2017
Indicators value changes by year
Minimum:
-5.678
jan 1, 1984
Maximum:
10.609
jan 1, 1974
At the date of observation
Value
Absolute change
Change from previous value
jan 1, 1967
7.281
+7.281
0.0%
jan 1, 1968
4.925
-2.356
-32.36%
jan 1, 1969
9.404
+4.479
90.94%
jan 1, 1970
5.735
-3.669
-39.02%
jan 1, 1971
7.898
+2.163
37.71%
jan 1, 1972
4.975
-2.922
-37.0%
jan 1, 1973
7.189
+2.214
44.5%
jan 1, 1974
10.609
+3.42
47.58%
jan 1, 1975
4.576
-6.033
-56.87%
jan 1, 1976
1.197
-3.379
-73.84%
jan 1, 1977
7.028
+5.831
487.18%
jan 1, 1978
3.553
-3.475
-49.44%
jan 1, 1979
7.002
+3.449
97.07%
jan 1, 1980
6.566
-0.436
-6.23%
jan 1, 1981
4.355
-2.212
-33.68%
jan 1, 1982
-2.633
-6.987
-160.45%
jan 1, 1983
-1.734
+0.899
-34.13%
jan 1, 1984
-5.678
-3.944
227.45%
jan 1, 1985
6.501
+12.179
-214.5%
jan 1, 1986
3.917
-2.584
-39.75%
jan 1, 1987
6.002
+2.085
53.23%
jan 1, 1988
2.536
-3.466
-57.75%
jan 1, 1989
0.393
-2.143
-84.49%
jan 1, 1990
0.41
+0.016
4.12%
jan 1, 1991
-0.495
-0.905
-220.93%
jan 1, 1992
1.913
+2.408
-486.25%
jan 1, 1993
1.823
-0.09
-4.7%
jan 1, 1994
4.696
+2.873
157.56%
jan 1, 1995
5.136
+0.44
9.37%
jan 1, 1996
0.799
-4.337
-84.44%
jan 1, 1997
2.465
+1.666
208.39%
jan 1, 1998
4.741
+2.277
92.37%
jan 1, 1999
1.147
-3.594
-75.81%
jan 1, 2000
-2.567
-3.714
-323.78%
jan 1, 2001
3.553
+6.12
-238.4%
jan 1, 2002
-0.695
-4.247
-119.56%
jan 1, 2003
-0.95
-0.255
36.67%
jan 1, 2004
0.444
+1.394
-146.75%
jan 1, 2005
8.15
+7.706
1.74K%
jan 1, 2006
3.606
-4.544
-55.76%
jan 1, 2007
4.527
+0.921
25.55%
jan 1, 2008
4.41
-0.117
-2.58%
jan 1, 2009
2.938
-1.472
-33.37%
jan 1, 2010
-4.585
-7.523
-256.06%
jan 1, 2011
5.665
+10.25
-223.55%
jan 1, 2012
4.265
-1.4
-24.71%
jan 1, 2013
1.545
-2.72
-63.78%
jan 1, 2014
1.56
+0.016
1.02%
jan 1, 2015
-0.171
-1.732
-110.99%
jan 1, 2016
-1.676
-1.505
877.63%
Ranking of countries by current statistics by years


Comments: