29
/
en
AIzaSyAYiBZKx7MnpbEhh9jyipgxe19OcubqV5w
April 1, 2024
287358
Zimbabwe
ZWE
true
2
1
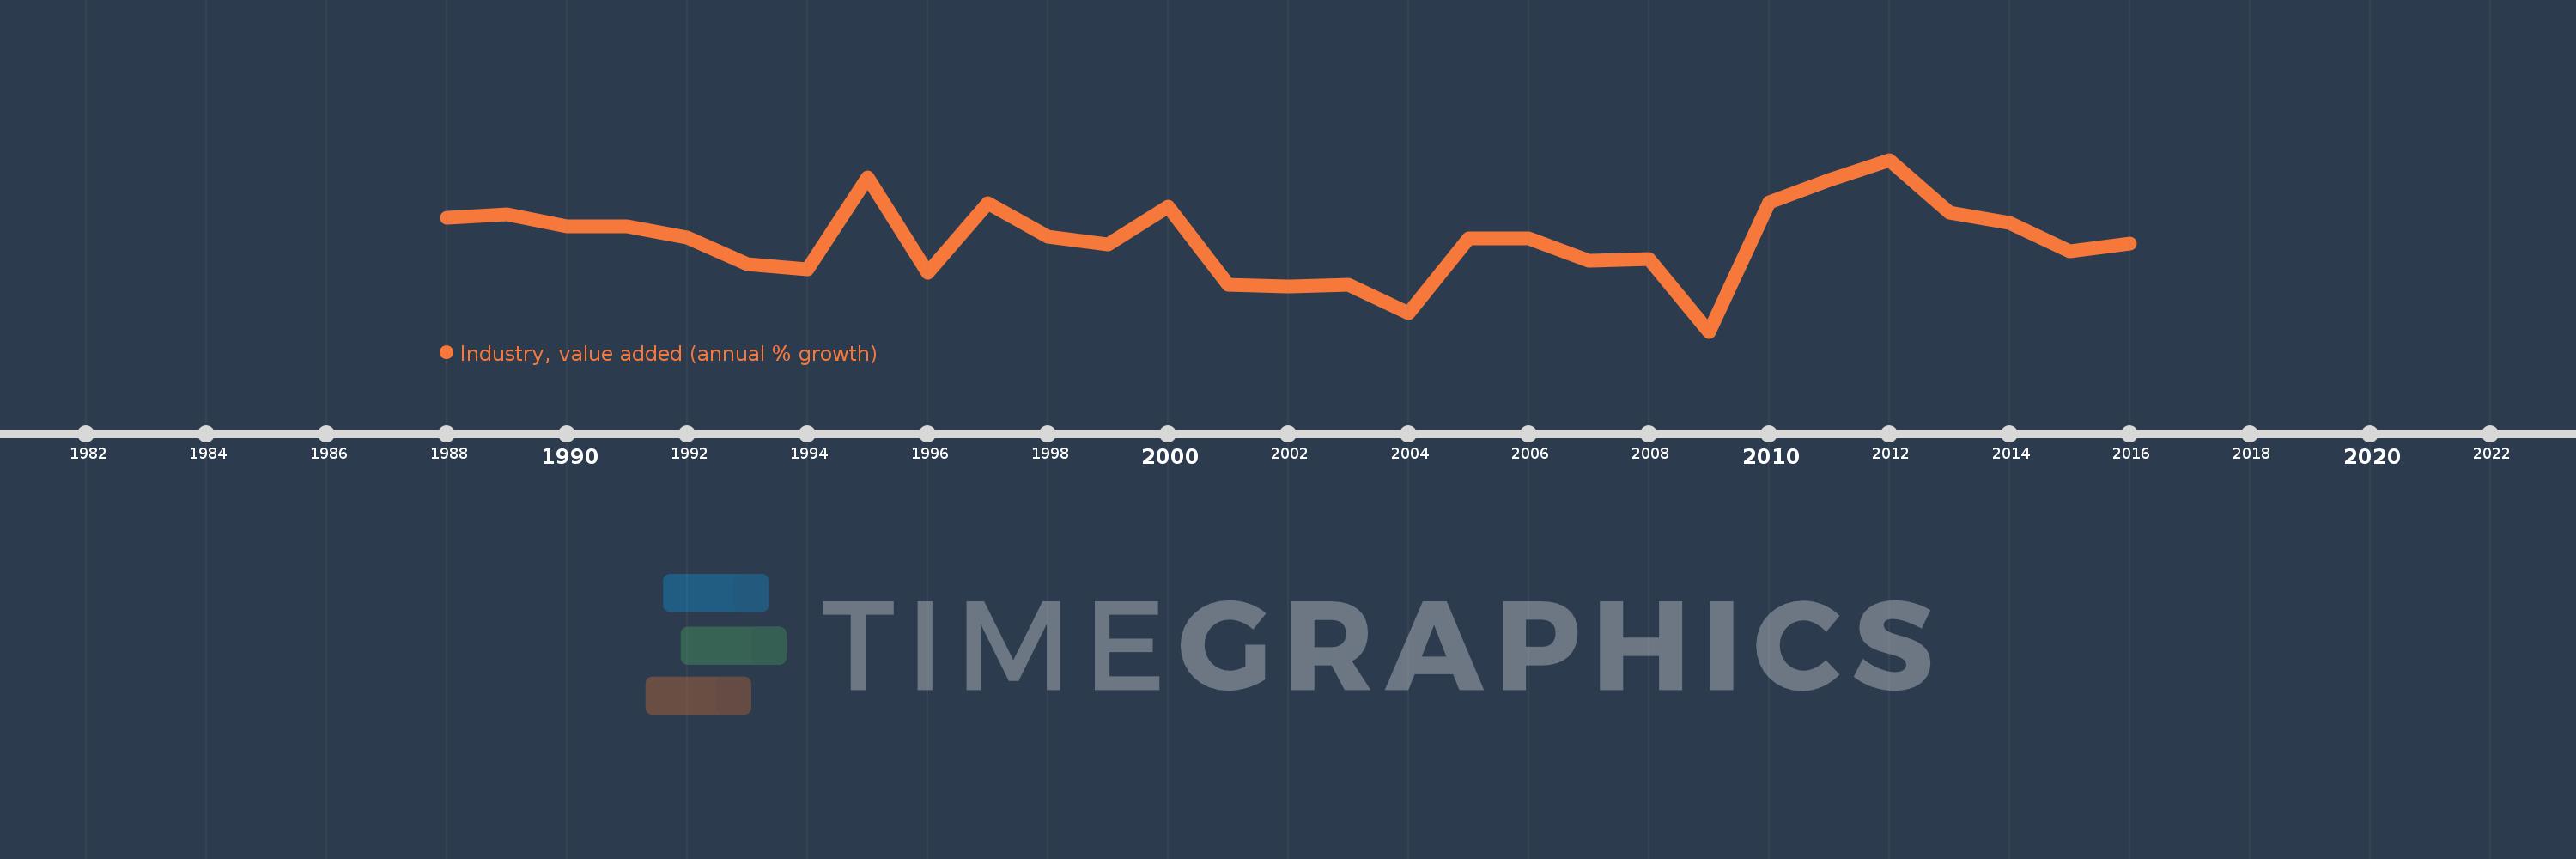
Industry, value added (annual % growth)
2016,2015,2014,2013,2012,2011,2010,2009,2008,2007,2006,2005,2004,2003,2002,2001,2000,1999,1998,1997,1996,1995,1994,1993,1992,1991,1990,1989,1988
This statistics in other country:
AfghanistanAlbaniaAlgeriaAntigua and BarbudaArab WorldArgentinaArmeniaAustraliaAustriaAzerbaijanBahamas, TheBahrainBangladeshBelarusBelgiumBelizeBeninBermudaBhutanBoliviaBosnia and HerzegovinaBotswanaBrazilBrunei DarussalamBulgariaBurkina FasoBurundiCabo VerdeCambodiaCameroonCanadaCaribbean small statesCayman IslandsCentral African RepublicCentral Europe and the BalticsChadChileChinaColombiaComorosCongo, Dem. Rep.Congo, Rep.Costa RicaCote d'IvoireCroatiaCubaCyprusCzech RepublicDenmarkDjiboutiDominicaDominican RepublicEarly-demographic dividendEast Asia & PacificEast Asia & Pacific (excluding high income)East Asia & Pacific (IDA & IBRD countries)EcuadorEgypt, Arab Rep.El SalvadorEquatorial GuineaEritreaEstoniaEthiopiaEuro areaEurope & Central AsiaEurope & Central Asia (excluding high income)Europe & Central Asia (IDA & IBRD countries)European UnionFijiFinlandFragile and conflict affected situationsFranceGabonGambia, TheGeorgiaGermanyGhanaGreeceGrenadaGuatemalaGuineaGuinea-BissauGuyanaHaitiHeavily indebted poor countries (HIPC)High incomeHondurasHong Kong SAR, ChinaHungaryIBRD onlyIcelandIDA & IBRD totalIDA blendIDA onlyIDA totalIndiaIndonesiaIran, Islamic Rep.IraqIrelandItalyJamaicaJapanJordanKazakhstanKenyaKiribatiKorea, Rep.KosovoKuwaitKyrgyz RepublicLao PDRLate-demographic dividendLatin America & Caribbean Latin America & Caribbean (excluding high income)Latin America & the Caribbean (IDA & IBRD countries)LatviaLeast developed countries: UN classificationLebanonLesothoLiberiaLithuaniaLow & middle incomeLow incomeLower middle incomeLuxembourgMacedonia, FYRMadagascarMalawiMalaysiaMaldivesMaliMarshall IslandsMauritaniaMauritiusMexicoMicronesia, Fed. Sts.Middle East & North AfricaMiddle East & North Africa (excluding high income)Middle East & North Africa (IDA & IBRD countries)Middle incomeMoldovaMongoliaMontenegroMoroccoMozambiqueMyanmarNamibiaNepalNetherlandsNew ZealandNicaraguaNigerNigeriaNorth AmericaNorwayOECD membersOmanOther small statesPacific island small statesPakistanPalauPanamaPapua New GuineaParaguayPeruPhilippinesPolandPortugalPost-demographic dividendPre-demographic dividendPuerto RicoQatarRomaniaRussian FederationRwandaSamoaSao Tome and PrincipeSaudi ArabiaSenegalSerbiaSeychellesSierra LeoneSingaporeSlovak RepublicSloveniaSmall statesSolomon IslandsSomaliaSouth AfricaSouth AsiaSouth Asia (IDA & IBRD)SpainSri LankaSt. Kitts and NevisSt. LuciaSt. Vincent and the GrenadinesSub-Saharan Africa Sub-Saharan Africa (excluding high income)Sub-Saharan Africa (IDA & IBRD countries)SudanSurinameSwazilandSwedenSwitzerlandSyrian Arab RepublicTajikistanTanzaniaThailandTimor-LesteTogoTongaTrinidad and TobagoTunisiaTurkeyTurkmenistanTuvaluUgandaUkraineUnited Arab EmiratesUnited KingdomUnited StatesUpper middle incomeUruguayUzbekistanVanuatuVenezuela, RBVietnamWest Bank and GazaWorldZambiaZimbabwe Timeline:
This timeline shows a graph from 1988 to 2016 of Zimbabwe. No data until 1987. Number of actual observations by date: 29.
Source name:
World Development Indicators
Source organization:
World Bank national accounts data, and OECD National Accounts data files.
Categories, topics:
Economy & Growth
Last updated:
apr 23, 2017
Indicators value changes by year
Minimum:
-20.914
jan 1, 2009
Maximum:
19.662
jan 1, 2012
At the date of observation
Value
Absolute change
Change from previous value
jan 1, 1988
5.949
+5.949
0.0%
jan 1, 1989
6.707
+0.759
12.76%
jan 1, 1990
4.025
-2.682
-39.99%
jan 1, 1991
3.995
-0.031
-0.76%
jan 1, 1992
1.238
-2.756
-69.01%
jan 1, 1993
-5.067
-6.305
-509.27%
jan 1, 1994
-6.222
-1.155
22.8%
jan 1, 1995
15.438
+21.661
-348.1%
jan 1, 1996
-7.056
-22.495
-145.71%
jan 1, 1997
9.459
+16.515
-234.04%
jan 1, 1998
1.542
-7.916
-83.69%
jan 1, 1999
-0.315
-1.857
-120.41%
jan 1, 2000
8.694
+9.009
-2.86K%
jan 1, 2001
-9.793
-18.487
-212.65%
jan 1, 2002
-10.208
-0.415
4.24%
jan 1, 2003
-9.915
+0.293
-2.87%
jan 1, 2004
-16.634
-6.718
67.76%
jan 1, 2005
1.037
+17.671
-106.24%
jan 1, 2006
1.156
+0.119
11.46%
jan 1, 2007
-4.152
-5.308
-459.15%
jan 1, 2008
-3.768
+0.384
-9.26%
jan 1, 2009
-20.914
-17.146
455.09%
jan 1, 2010
9.661
+30.575
-146.19%
jan 1, 2011
14.888
+5.227
54.11%
jan 1, 2012
19.662
+4.774
32.07%
jan 1, 2013
7.266
-12.396
-63.04%
jan 1, 2014
4.766
-2.5
-34.41%
jan 1, 2015
-1.981
-6.747
-141.57%
jan 1, 2016
-0.019
+1.962
-99.04%
Ranking of countries by current statistics by years


Comments: