29
/
en
AIzaSyAYiBZKx7MnpbEhh9jyipgxe19OcubqV5w
April 1, 2024
96266
Burundi
BDI
true
2
1
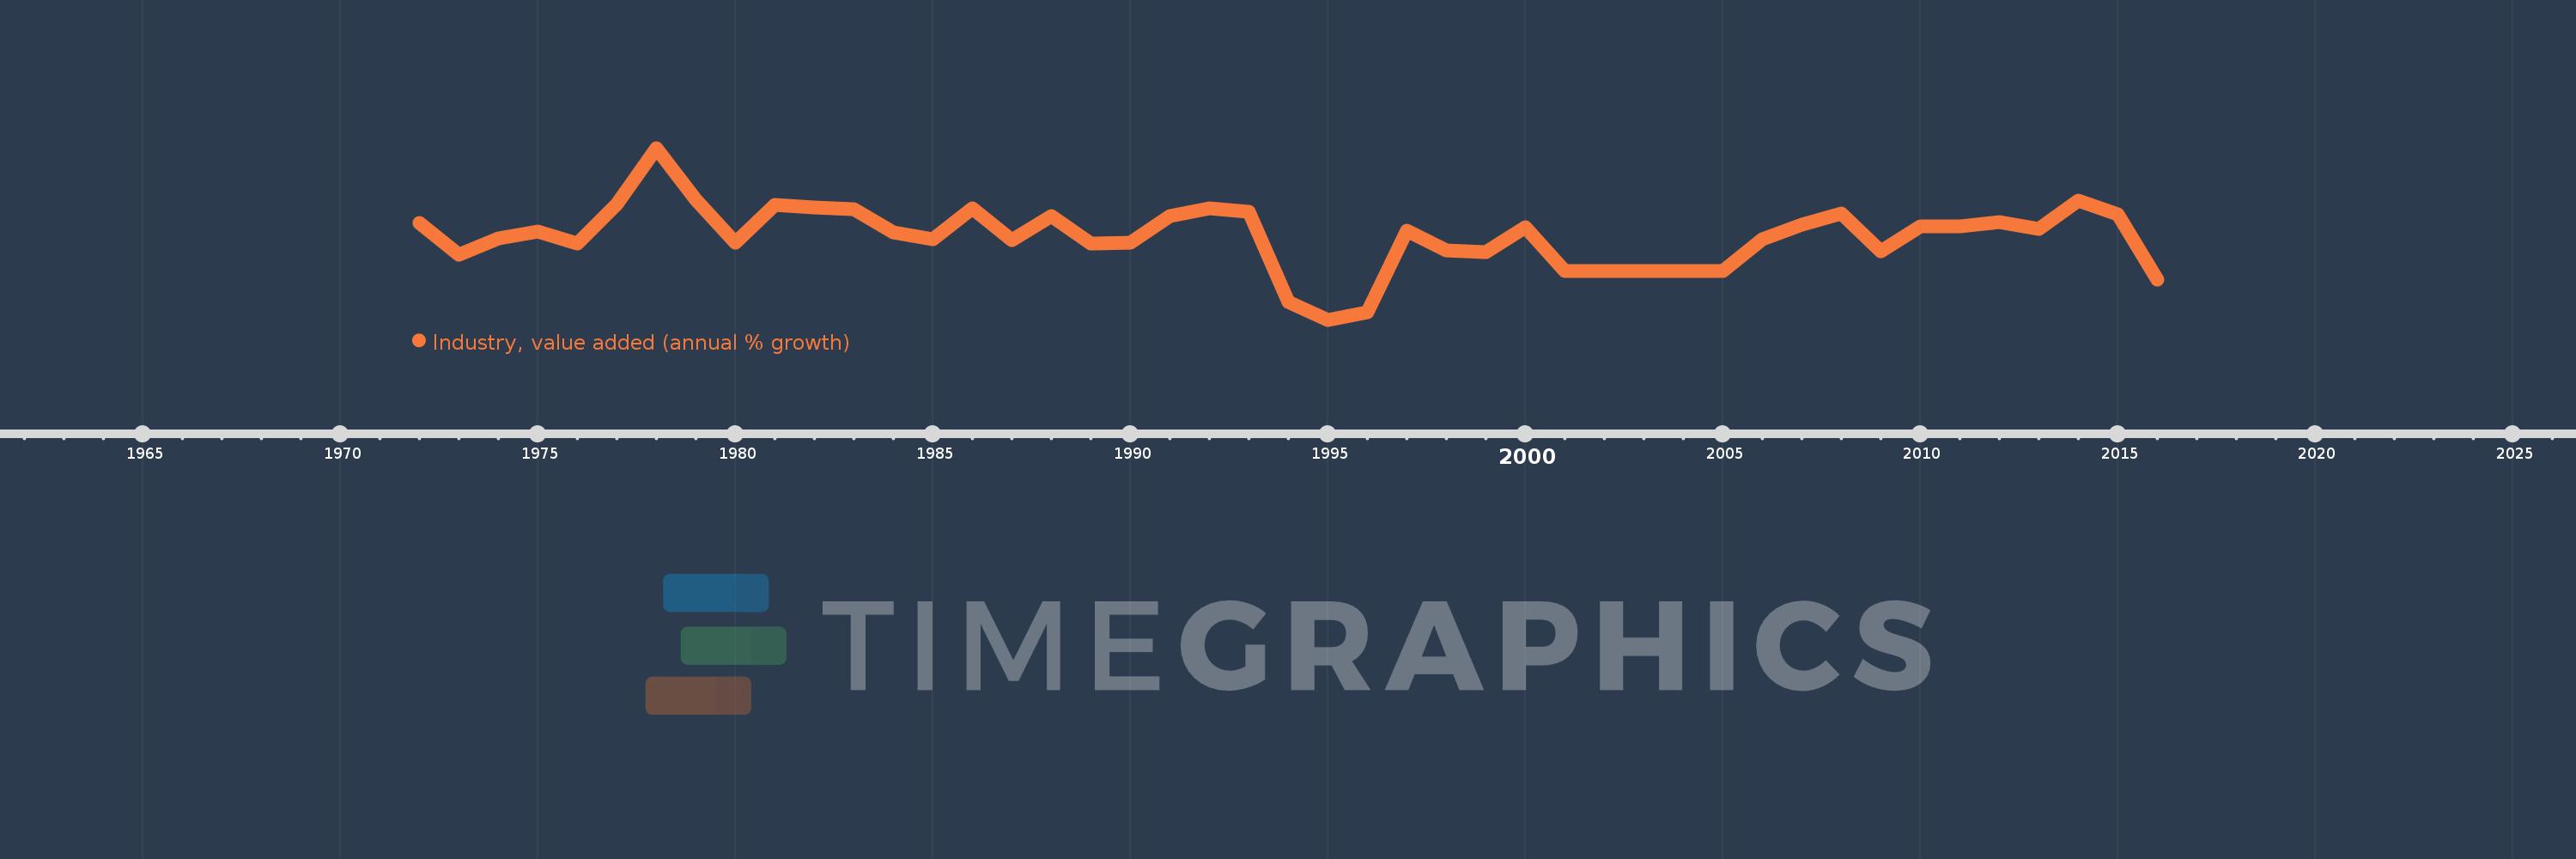
Industry, value added (annual % growth)
2016,2015,2014,2013,2012,2011,2010,2009,2008,2007,2006,2005,2004,2003,2002,2001,2000,1999,1998,1997,1996,1995,1994,1993,1992,1991,1990,1989,1988,1987,1986,1985,1984,1983,1982,1981,1980,1979,1978,1977,1976,1975,1974,1973,1972
This statistics in other country:
AfghanistanAlbaniaAlgeriaAntigua and BarbudaArab WorldArgentinaArmeniaAustraliaAustriaAzerbaijanBahamas, TheBahrainBangladeshBelarusBelgiumBelizeBeninBermudaBhutanBoliviaBosnia and HerzegovinaBotswanaBrazilBrunei DarussalamBulgariaBurkina FasoBurundiCabo VerdeCambodiaCameroonCanadaCaribbean small statesCayman IslandsCentral African RepublicCentral Europe and the BalticsChadChileChinaColombiaComorosCongo, Dem. Rep.Congo, Rep.Costa RicaCote d'IvoireCroatiaCubaCyprusCzech RepublicDenmarkDjiboutiDominicaDominican RepublicEarly-demographic dividendEast Asia & PacificEast Asia & Pacific (excluding high income)East Asia & Pacific (IDA & IBRD countries)EcuadorEgypt, Arab Rep.El SalvadorEquatorial GuineaEritreaEstoniaEthiopiaEuro areaEurope & Central AsiaEurope & Central Asia (excluding high income)Europe & Central Asia (IDA & IBRD countries)European UnionFijiFinlandFragile and conflict affected situationsFranceGabonGambia, TheGeorgiaGermanyGhanaGreeceGrenadaGuatemalaGuineaGuinea-BissauGuyanaHaitiHeavily indebted poor countries (HIPC)High incomeHondurasHong Kong SAR, ChinaHungaryIBRD onlyIcelandIDA & IBRD totalIDA blendIDA onlyIDA totalIndiaIndonesiaIran, Islamic Rep.IraqIrelandItalyJamaicaJapanJordanKazakhstanKenyaKiribatiKorea, Rep.KosovoKuwaitKyrgyz RepublicLao PDRLate-demographic dividendLatin America & Caribbean Latin America & Caribbean (excluding high income)Latin America & the Caribbean (IDA & IBRD countries)LatviaLeast developed countries: UN classificationLebanonLesothoLiberiaLithuaniaLow & middle incomeLow incomeLower middle incomeLuxembourgMacedonia, FYRMadagascarMalawiMalaysiaMaldivesMaliMarshall IslandsMauritaniaMauritiusMexicoMicronesia, Fed. Sts.Middle East & North AfricaMiddle East & North Africa (excluding high income)Middle East & North Africa (IDA & IBRD countries)Middle incomeMoldovaMongoliaMontenegroMoroccoMozambiqueMyanmarNamibiaNepalNetherlandsNew ZealandNicaraguaNigerNigeriaNorth AmericaNorwayOECD membersOmanOther small statesPacific island small statesPakistanPalauPanamaPapua New GuineaParaguayPeruPhilippinesPolandPortugalPost-demographic dividendPre-demographic dividendPuerto RicoQatarRomaniaRussian FederationRwandaSamoaSao Tome and PrincipeSaudi ArabiaSenegalSerbiaSeychellesSierra LeoneSingaporeSlovak RepublicSloveniaSmall statesSolomon IslandsSomaliaSouth AfricaSouth AsiaSouth Asia (IDA & IBRD)SpainSri LankaSt. Kitts and NevisSt. LuciaSt. Vincent and the GrenadinesSub-Saharan Africa Sub-Saharan Africa (excluding high income)Sub-Saharan Africa (IDA & IBRD countries)SudanSurinameSwazilandSwedenSwitzerlandSyrian Arab RepublicTajikistanTanzaniaThailandTimor-LesteTogoTongaTrinidad and TobagoTunisiaTurkeyTurkmenistanTuvaluUgandaUkraineUnited Arab EmiratesUnited KingdomUnited StatesUpper middle incomeUruguayUzbekistanVanuatuVenezuela, RBVietnamWest Bank and GazaWorldZambiaZimbabwe Timeline:
This timeline shows a graph from 1972 to 2016 of Burundi. No data until 1971. Number of actual observations by date: 45.
Source name:
World Development Indicators
Source organization:
World Bank national accounts data, and OECD National Accounts data files.
Categories, topics:
Economy & Growth
Last updated:
apr 23, 2017
Indicators value changes by year
Minimum:
-18.47
jan 1, 1995
Maximum:
24.436
jan 1, 1978
At the date of observation
Value
Absolute change
Change from previous value
jan 1, 1972
5.627
+5.627
0.0%
jan 1, 1973
-2.326
-7.953
-141.33%
jan 1, 1974
1.863
+4.188
-180.08%
jan 1, 1975
3.664
+1.801
96.72%
jan 1, 1976
0.627
-3.037
-82.89%
jan 1, 1977
10.344
+9.717
1.55K%
jan 1, 1978
24.436
+14.092
136.23%
jan 1, 1979
11.416
-13.02
-53.28%
jan 1, 1980
0.811
-10.605
-92.89%
jan 1, 1981
10.131
+9.32
1.15K%
jan 1, 1982
9.575
-0.556
-5.49%
jan 1, 1983
9.247
-0.328
-3.43%
jan 1, 1984
3.247
-6.0
-64.88%
jan 1, 1985
1.541
-1.706
-52.54%
jan 1, 1986
9.308
+7.767
504.01%
jan 1, 1987
1.324
-7.985
-85.78%
jan 1, 1988
7.411
+6.087
459.92%
jan 1, 1989
0.555
-6.855
-92.51%
jan 1, 1990
0.719
+0.164
29.49%
jan 1, 1991
7.488
+6.769
941.22%
jan 1, 1992
9.28
+1.792
23.93%
jan 1, 1993
8.57
-0.71
-7.65%
jan 1, 1994
-14.02
-22.59
-263.59%
jan 1, 1995
-18.47
-4.45
31.74%
jan 1, 1996
-16.59
+1.88
-10.18%
jan 1, 1997
3.88
+20.47
-123.39%
jan 1, 1998
-1.051
-4.931
-127.08%
jan 1, 1999
-1.59
-0.539
51.31%
jan 1, 2000
4.59
+6.18
-388.68%
jan 1, 2001
-6.23
-10.82
-235.73%
jan 1, 2002
-6.23
0.0
0.0%
jan 1, 2003
-6.23
+0.0
0.0%
jan 1, 2004
-6.23
0.0
0.0%
jan 1, 2005
-6.23
0.0
0.0%
jan 1, 2006
1.551
+7.781
-124.89%
jan 1, 2007
5.37
+3.819
246.27%
jan 1, 2008
8.158
+2.787
51.9%
jan 1, 2009
-1.416
-9.574
-117.36%
jan 1, 2010
4.932
+6.348
-448.28%
jan 1, 2011
4.899
-0.033
-0.66%
jan 1, 2012
5.89
+0.99
20.22%
jan 1, 2013
4.11
-1.78
-30.22%
jan 1, 2014
11.228
+7.119
173.21%
jan 1, 2015
7.952
-3.277
-29.18%
jan 1, 2016
-8.5
-16.451
-206.89%
Ranking of countries by current statistics by years


Comments: