29
/
en
AIzaSyAYiBZKx7MnpbEhh9jyipgxe19OcubqV5w
April 1, 2024
84241
Benin
BEN
true
2
1
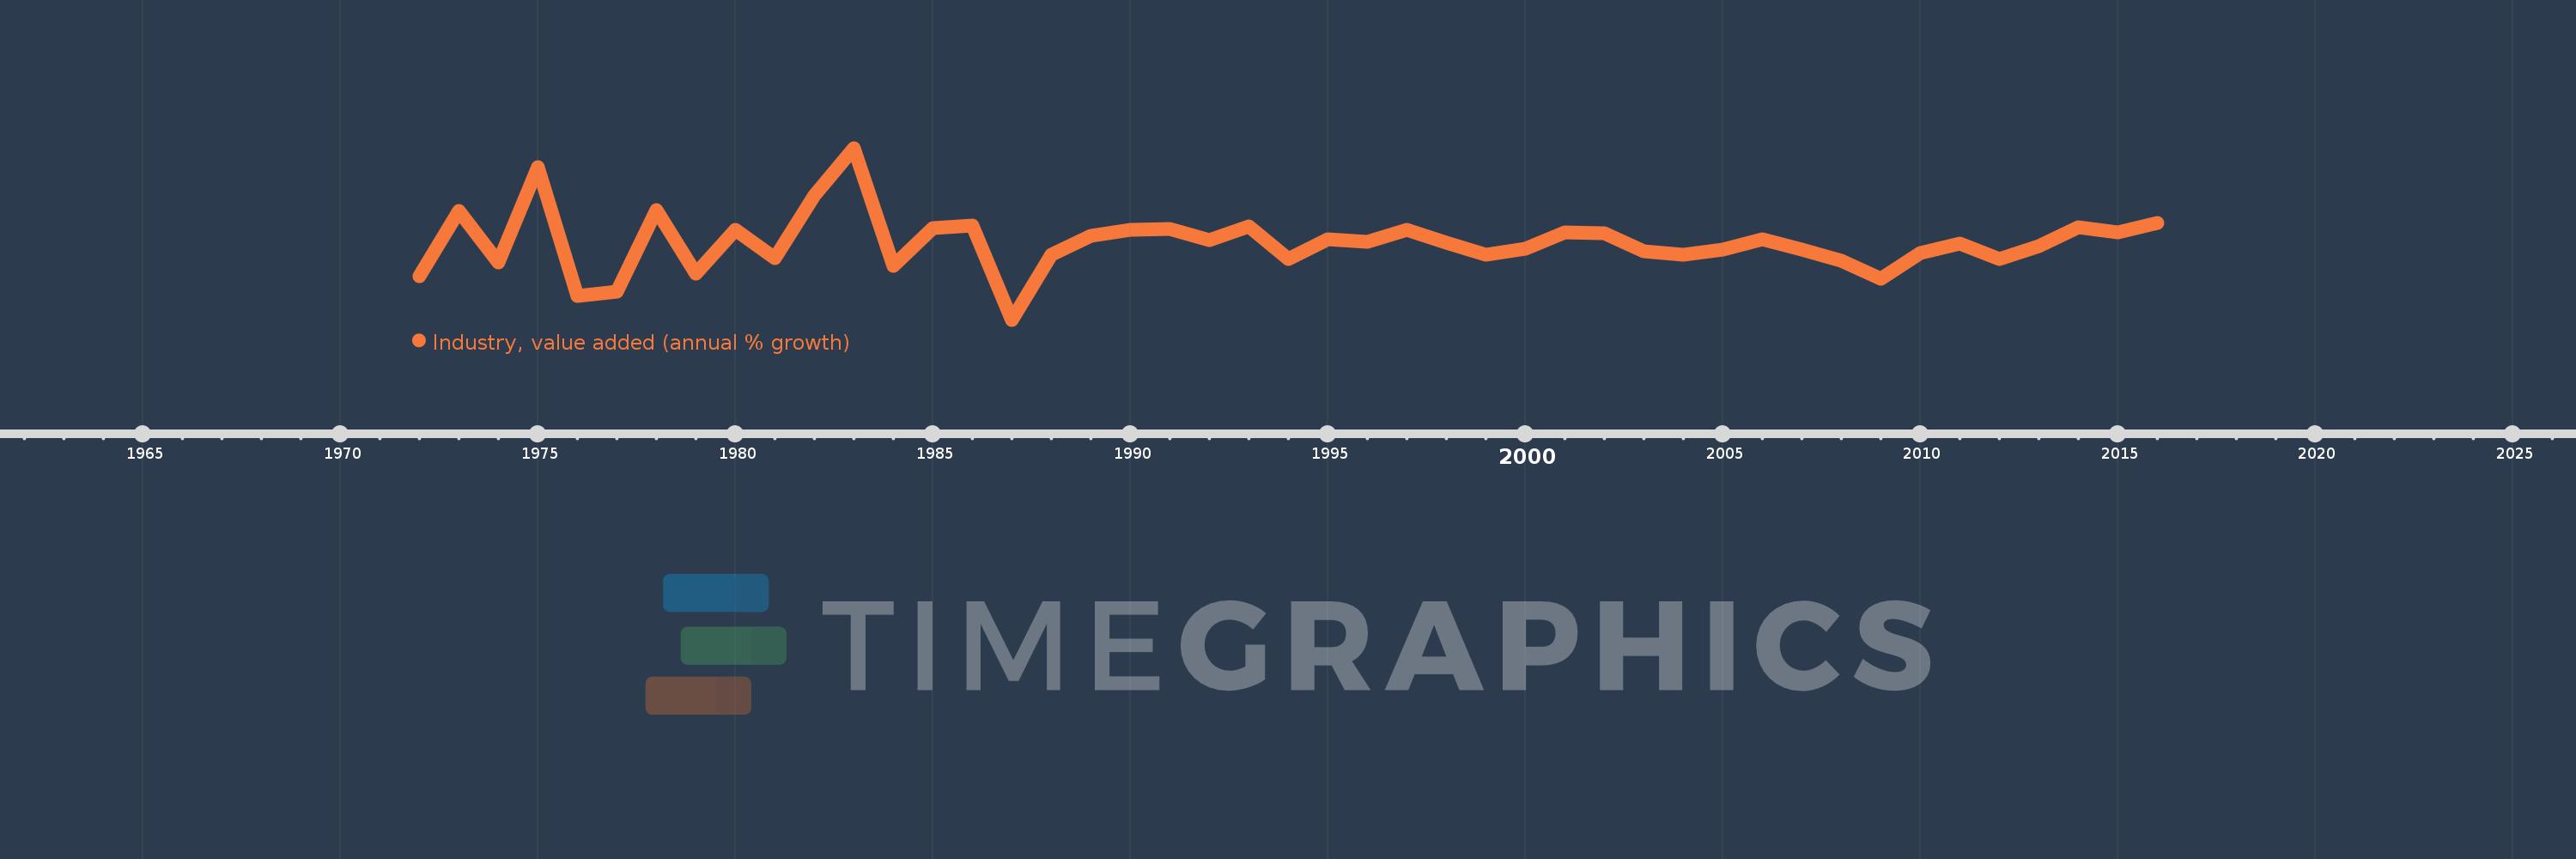
Industry, value added (annual % growth)
2016,2015,2014,2013,2012,2011,2010,2009,2008,2007,2006,2005,2004,2003,2002,2001,2000,1999,1998,1997,1996,1995,1994,1993,1992,1991,1990,1989,1988,1987,1986,1985,1984,1983,1982,1981,1980,1979,1978,1977,1976,1975,1974,1973,1972
This statistics in other country:
AfghanistanAlbaniaAlgeriaAntigua and BarbudaArab WorldArgentinaArmeniaAustraliaAustriaAzerbaijanBahamas, TheBahrainBangladeshBelarusBelgiumBelizeBeninBermudaBhutanBoliviaBosnia and HerzegovinaBotswanaBrazilBrunei DarussalamBulgariaBurkina FasoBurundiCabo VerdeCambodiaCameroonCanadaCaribbean small statesCayman IslandsCentral African RepublicCentral Europe and the BalticsChadChileChinaColombiaComorosCongo, Dem. Rep.Congo, Rep.Costa RicaCote d'IvoireCroatiaCubaCyprusCzech RepublicDenmarkDjiboutiDominicaDominican RepublicEarly-demographic dividendEast Asia & PacificEast Asia & Pacific (excluding high income)East Asia & Pacific (IDA & IBRD countries)EcuadorEgypt, Arab Rep.El SalvadorEquatorial GuineaEritreaEstoniaEthiopiaEuro areaEurope & Central AsiaEurope & Central Asia (excluding high income)Europe & Central Asia (IDA & IBRD countries)European UnionFijiFinlandFragile and conflict affected situationsFranceGabonGambia, TheGeorgiaGermanyGhanaGreeceGrenadaGuatemalaGuineaGuinea-BissauGuyanaHaitiHeavily indebted poor countries (HIPC)High incomeHondurasHong Kong SAR, ChinaHungaryIBRD onlyIcelandIDA & IBRD totalIDA blendIDA onlyIDA totalIndiaIndonesiaIran, Islamic Rep.IraqIrelandItalyJamaicaJapanJordanKazakhstanKenyaKiribatiKorea, Rep.KosovoKuwaitKyrgyz RepublicLao PDRLate-demographic dividendLatin America & Caribbean Latin America & Caribbean (excluding high income)Latin America & the Caribbean (IDA & IBRD countries)LatviaLeast developed countries: UN classificationLebanonLesothoLiberiaLithuaniaLow & middle incomeLow incomeLower middle incomeLuxembourgMacedonia, FYRMadagascarMalawiMalaysiaMaldivesMaliMarshall IslandsMauritaniaMauritiusMexicoMicronesia, Fed. Sts.Middle East & North AfricaMiddle East & North Africa (excluding high income)Middle East & North Africa (IDA & IBRD countries)Middle incomeMoldovaMongoliaMontenegroMoroccoMozambiqueMyanmarNamibiaNepalNetherlandsNew ZealandNicaraguaNigerNigeriaNorth AmericaNorwayOECD membersOmanOther small statesPacific island small statesPakistanPalauPanamaPapua New GuineaParaguayPeruPhilippinesPolandPortugalPost-demographic dividendPre-demographic dividendPuerto RicoQatarRomaniaRussian FederationRwandaSamoaSao Tome and PrincipeSaudi ArabiaSenegalSerbiaSeychellesSierra LeoneSingaporeSlovak RepublicSloveniaSmall statesSolomon IslandsSomaliaSouth AfricaSouth AsiaSouth Asia (IDA & IBRD)SpainSri LankaSt. Kitts and NevisSt. LuciaSt. Vincent and the GrenadinesSub-Saharan Africa Sub-Saharan Africa (excluding high income)Sub-Saharan Africa (IDA & IBRD countries)SudanSurinameSwazilandSwedenSwitzerlandSyrian Arab RepublicTajikistanTanzaniaThailandTimor-LesteTogoTongaTrinidad and TobagoTunisiaTurkeyTurkmenistanTuvaluUgandaUkraineUnited Arab EmiratesUnited KingdomUnited StatesUpper middle incomeUruguayUzbekistanVanuatuVenezuela, RBVietnamWest Bank and GazaWorldZambiaZimbabwe Timeline:
This timeline shows a graph from 1972 to 2016 of Benin. No data until 1971. Number of actual observations by date: 45.
Source name:
World Development Indicators
Source organization:
World Bank national accounts data, and OECD National Accounts data files.
Categories, topics:
Economy & Growth
Last updated:
apr 23, 2017
Indicators value changes by year
Minimum:
-21.374
jan 1, 1987
Maximum:
34.386
jan 1, 1983
At the date of observation
Value
Absolute change
Change from previous value
jan 1, 1972
-7.247
-7.247
0.0%
jan 1, 1973
14.054
+21.301
-293.93%
jan 1, 1974
-2.84
-16.894
-120.21%
jan 1, 1975
28.261
+31.101
-1.1K%
jan 1, 1976
-13.567
-41.827
-148.01%
jan 1, 1977
-12.374
+1.193
-8.79%
jan 1, 1978
14.26
+26.634
-215.24%
jan 1, 1979
-6.271
-20.531
-143.97%
jan 1, 1980
7.83
+14.1
-224.86%
jan 1, 1981
-1.278
-9.107
-116.32%
jan 1, 1982
19.099
+20.377
-1.59K%
jan 1, 1983
34.386
+15.287
80.04%
jan 1, 1984
-3.907
-38.293
-111.36%
jan 1, 1985
8.434
+12.341
-315.84%
jan 1, 1986
9.167
+0.733
8.69%
jan 1, 1987
-21.374
-30.541
-333.17%
jan 1, 1988
-0.162
+21.212
-99.24%
jan 1, 1989
5.997
+6.159
-3.81K%
jan 1, 1990
7.804
+1.808
30.14%
jan 1, 1991
8.2
+0.395
5.07%
jan 1, 1992
4.537
-3.663
-44.67%
jan 1, 1993
9.052
+4.515
99.53%
jan 1, 1994
-1.794
-10.846
-119.81%
jan 1, 1995
4.834
+6.628
-369.5%
jan 1, 1996
3.921
-0.913
-18.88%
jan 1, 1997
7.696
+3.775
96.27%
jan 1, 1998
3.508
-4.188
-54.41%
jan 1, 1999
-0.188
-3.696
-105.35%
jan 1, 2000
1.75
+1.937
-1.03K%
jan 1, 2001
6.928
+5.179
295.97%
jan 1, 2002
6.773
-0.155
-2.24%
jan 1, 2003
0.841
-5.933
-87.59%
jan 1, 2004
-0.364
-1.205
-143.27%
jan 1, 2005
1.506
+1.87
-514.01%
jan 1, 2006
4.856
+3.35
222.42%
jan 1, 2007
1.487
-3.37
-69.39%
jan 1, 2008
-2.324
-3.811
-256.33%
jan 1, 2009
-8.017
-5.693
244.99%
jan 1, 2010
0.235
+8.252
-102.93%
jan 1, 2011
3.284
+3.049
1.3K%
jan 1, 2012
-1.772
-5.056
-153.94%
jan 1, 2013
2.466
+4.238
-239.22%
jan 1, 2014
8.711
+6.244
253.16%
jan 1, 2015
6.989
-1.722
-19.77%
jan 1, 2016
10.102
+3.114
44.55%
Ranking of countries by current statistics by years


Comments: