29
/
en
AIzaSyAYiBZKx7MnpbEhh9jyipgxe19OcubqV5w
April 1, 2024
265895
Tonga
TON
true
2
1
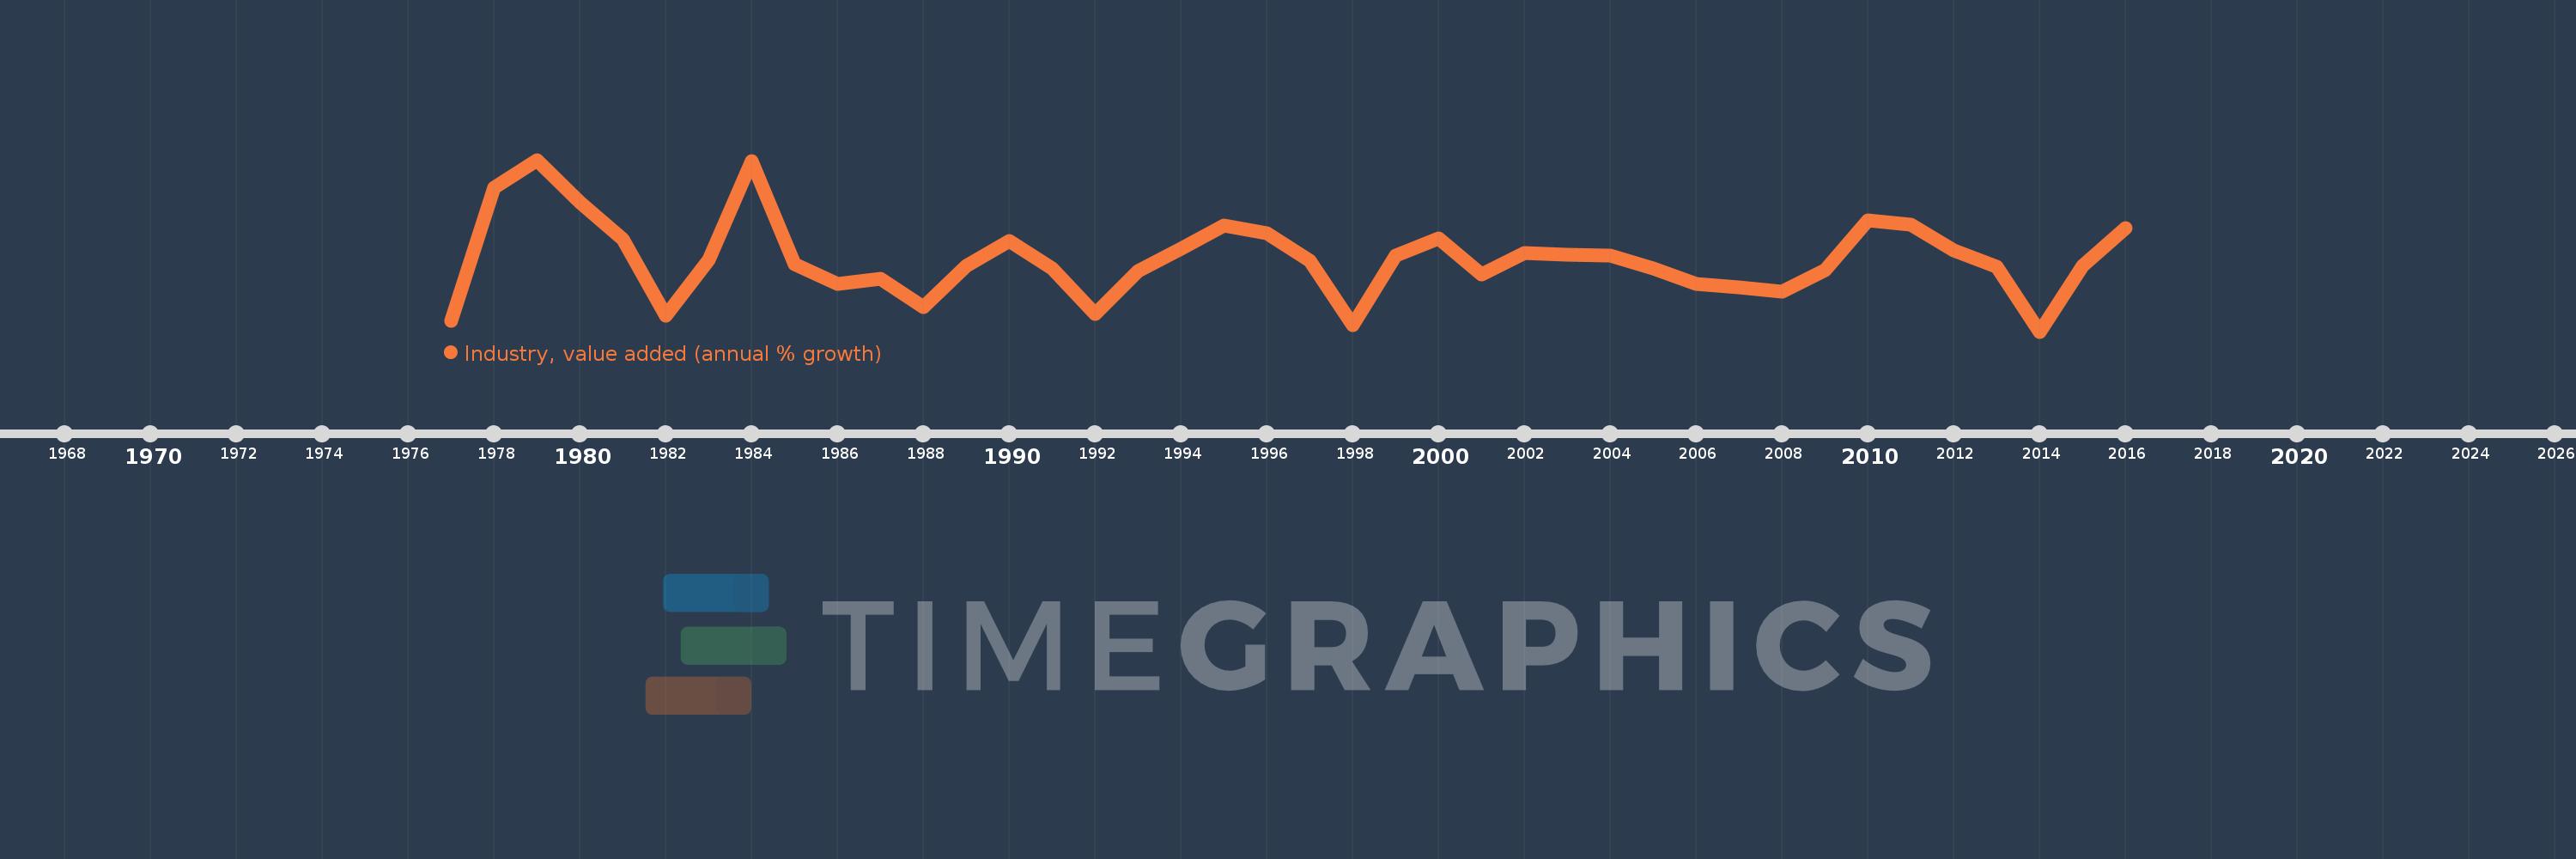
Industry, value added (annual % growth)
2016,2015,2014,2013,2012,2011,2010,2009,2008,2007,2006,2005,2004,2003,2002,2001,2000,1999,1998,1997,1996,1995,1994,1993,1992,1991,1990,1989,1988,1987,1986,1985,1984,1983,1982,1981,1980,1979,1978,1977
This statistics in other country:
AfghanistanAlbaniaAlgeriaAntigua and BarbudaArab WorldArgentinaArmeniaAustraliaAustriaAzerbaijanBahamas, TheBahrainBangladeshBelarusBelgiumBelizeBeninBermudaBhutanBoliviaBosnia and HerzegovinaBotswanaBrazilBrunei DarussalamBulgariaBurkina FasoBurundiCabo VerdeCambodiaCameroonCanadaCaribbean small statesCayman IslandsCentral African RepublicCentral Europe and the BalticsChadChileChinaColombiaComorosCongo, Dem. Rep.Congo, Rep.Costa RicaCote d'IvoireCroatiaCubaCyprusCzech RepublicDenmarkDjiboutiDominicaDominican RepublicEarly-demographic dividendEast Asia & PacificEast Asia & Pacific (excluding high income)East Asia & Pacific (IDA & IBRD countries)EcuadorEgypt, Arab Rep.El SalvadorEquatorial GuineaEritreaEstoniaEthiopiaEuro areaEurope & Central AsiaEurope & Central Asia (excluding high income)Europe & Central Asia (IDA & IBRD countries)European UnionFijiFinlandFragile and conflict affected situationsFranceGabonGambia, TheGeorgiaGermanyGhanaGreeceGrenadaGuatemalaGuineaGuinea-BissauGuyanaHaitiHeavily indebted poor countries (HIPC)High incomeHondurasHong Kong SAR, ChinaHungaryIBRD onlyIcelandIDA & IBRD totalIDA blendIDA onlyIDA totalIndiaIndonesiaIran, Islamic Rep.IraqIrelandItalyJamaicaJapanJordanKazakhstanKenyaKiribatiKorea, Rep.KosovoKuwaitKyrgyz RepublicLao PDRLate-demographic dividendLatin America & Caribbean Latin America & Caribbean (excluding high income)Latin America & the Caribbean (IDA & IBRD countries)LatviaLeast developed countries: UN classificationLebanonLesothoLiberiaLithuaniaLow & middle incomeLow incomeLower middle incomeLuxembourgMacedonia, FYRMadagascarMalawiMalaysiaMaldivesMaliMarshall IslandsMauritaniaMauritiusMexicoMicronesia, Fed. Sts.Middle East & North AfricaMiddle East & North Africa (excluding high income)Middle East & North Africa (IDA & IBRD countries)Middle incomeMoldovaMongoliaMontenegroMoroccoMozambiqueMyanmarNamibiaNepalNetherlandsNew ZealandNicaraguaNigerNigeriaNorth AmericaNorwayOECD membersOmanOther small statesPacific island small statesPakistanPalauPanamaPapua New GuineaParaguayPeruPhilippinesPolandPortugalPost-demographic dividendPre-demographic dividendPuerto RicoQatarRomaniaRussian FederationRwandaSamoaSao Tome and PrincipeSaudi ArabiaSenegalSerbiaSeychellesSierra LeoneSingaporeSlovak RepublicSloveniaSmall statesSolomon IslandsSomaliaSouth AfricaSouth AsiaSouth Asia (IDA & IBRD)SpainSri LankaSt. Kitts and NevisSt. LuciaSt. Vincent and the GrenadinesSub-Saharan Africa Sub-Saharan Africa (excluding high income)Sub-Saharan Africa (IDA & IBRD countries)SudanSurinameSwazilandSwedenSwitzerlandSyrian Arab RepublicTajikistanTanzaniaThailandTimor-LesteTogoTongaTrinidad and TobagoTunisiaTurkeyTurkmenistanTuvaluUgandaUkraineUnited Arab EmiratesUnited KingdomUnited StatesUpper middle incomeUruguayUzbekistanVanuatuVenezuela, RBVietnamWest Bank and GazaWorldZambiaZimbabwe Timeline:
This timeline shows a graph from 1977 to 2016 of Tonga. No data until 1976. Number of actual observations by date: 40.
Source name:
World Development Indicators
Source organization:
World Bank national accounts data, and OECD National Accounts data files.
Categories, topics:
Economy & Growth
Last updated:
apr 23, 2017
Indicators value changes by year
Minimum:
-14.489
jan 1, 2014
Maximum:
27.708
jan 1, 1979
At the date of observation
Value
Absolute change
Change from previous value
jan 1, 1977
-11.885
-11.885
0.0%
jan 1, 1978
20.901
+32.786
-275.85%
jan 1, 1979
27.708
+6.807
32.57%
jan 1, 1980
17.29
-10.418
-37.6%
jan 1, 1981
8.118
-9.173
-53.05%
jan 1, 1982
-10.577
-18.695
-230.3%
jan 1, 1983
3.194
+13.771
-130.2%
jan 1, 1984
27.337
+24.143
755.88%
jan 1, 1985
2.14
-25.196
-92.17%
jan 1, 1986
-2.824
-4.964
-231.94%
jan 1, 1987
-1.583
+1.241
-43.96%
jan 1, 1988
-8.454
-6.871
434.17%
jan 1, 1989
1.561
+10.015
-118.47%
jan 1, 1990
7.747
+6.186
396.18%
jan 1, 1991
1.033
-6.715
-86.67%
jan 1, 1992
-10.081
-11.113
-1.08K%
jan 1, 1993
0.31
+10.391
-103.07%
jan 1, 1994
5.789
+5.479
1.77K%
jan 1, 1995
11.47
+5.681
98.14%
jan 1, 1996
9.737
-1.734
-15.11%
jan 1, 1997
2.94
-6.797
-69.81%
jan 1, 1998
-12.92
-15.86
-539.52%
jan 1, 1999
4.174
+17.095
-132.31%
jan 1, 2000
8.333
+4.159
99.63%
jan 1, 2001
-0.415
-8.748
-104.97%
jan 1, 2002
4.877
+5.292
-1.28K%
jan 1, 2003
4.486
-0.391
-8.01%
jan 1, 2004
4.194
-0.292
-6.52%
jan 1, 2005
1.107
-3.087
-73.59%
jan 1, 2006
-2.846
-3.954
-357.0%
jan 1, 2007
-3.52
-0.673
23.66%
jan 1, 2008
-4.583
-1.064
30.22%
jan 1, 2009
0.649
+5.232
-114.16%
jan 1, 2010
12.776
+12.127
1.87K%
jan 1, 2011
11.739
-1.037
-8.12%
jan 1, 2012
5.493
-6.246
-53.21%
jan 1, 2013
1.413
-4.08
-74.27%
jan 1, 2014
-14.489
-15.902
-1.13K%
jan 1, 2015
1.649
+16.138
-111.38%
jan 1, 2016
10.865
+9.217
559.07%
Ranking of countries by current statistics by years


Comments: