29
/
en
AIzaSyAYiBZKx7MnpbEhh9jyipgxe19OcubqV5w
April 1, 2024
37453
IDA & IBRD total
IBT
false
2
1
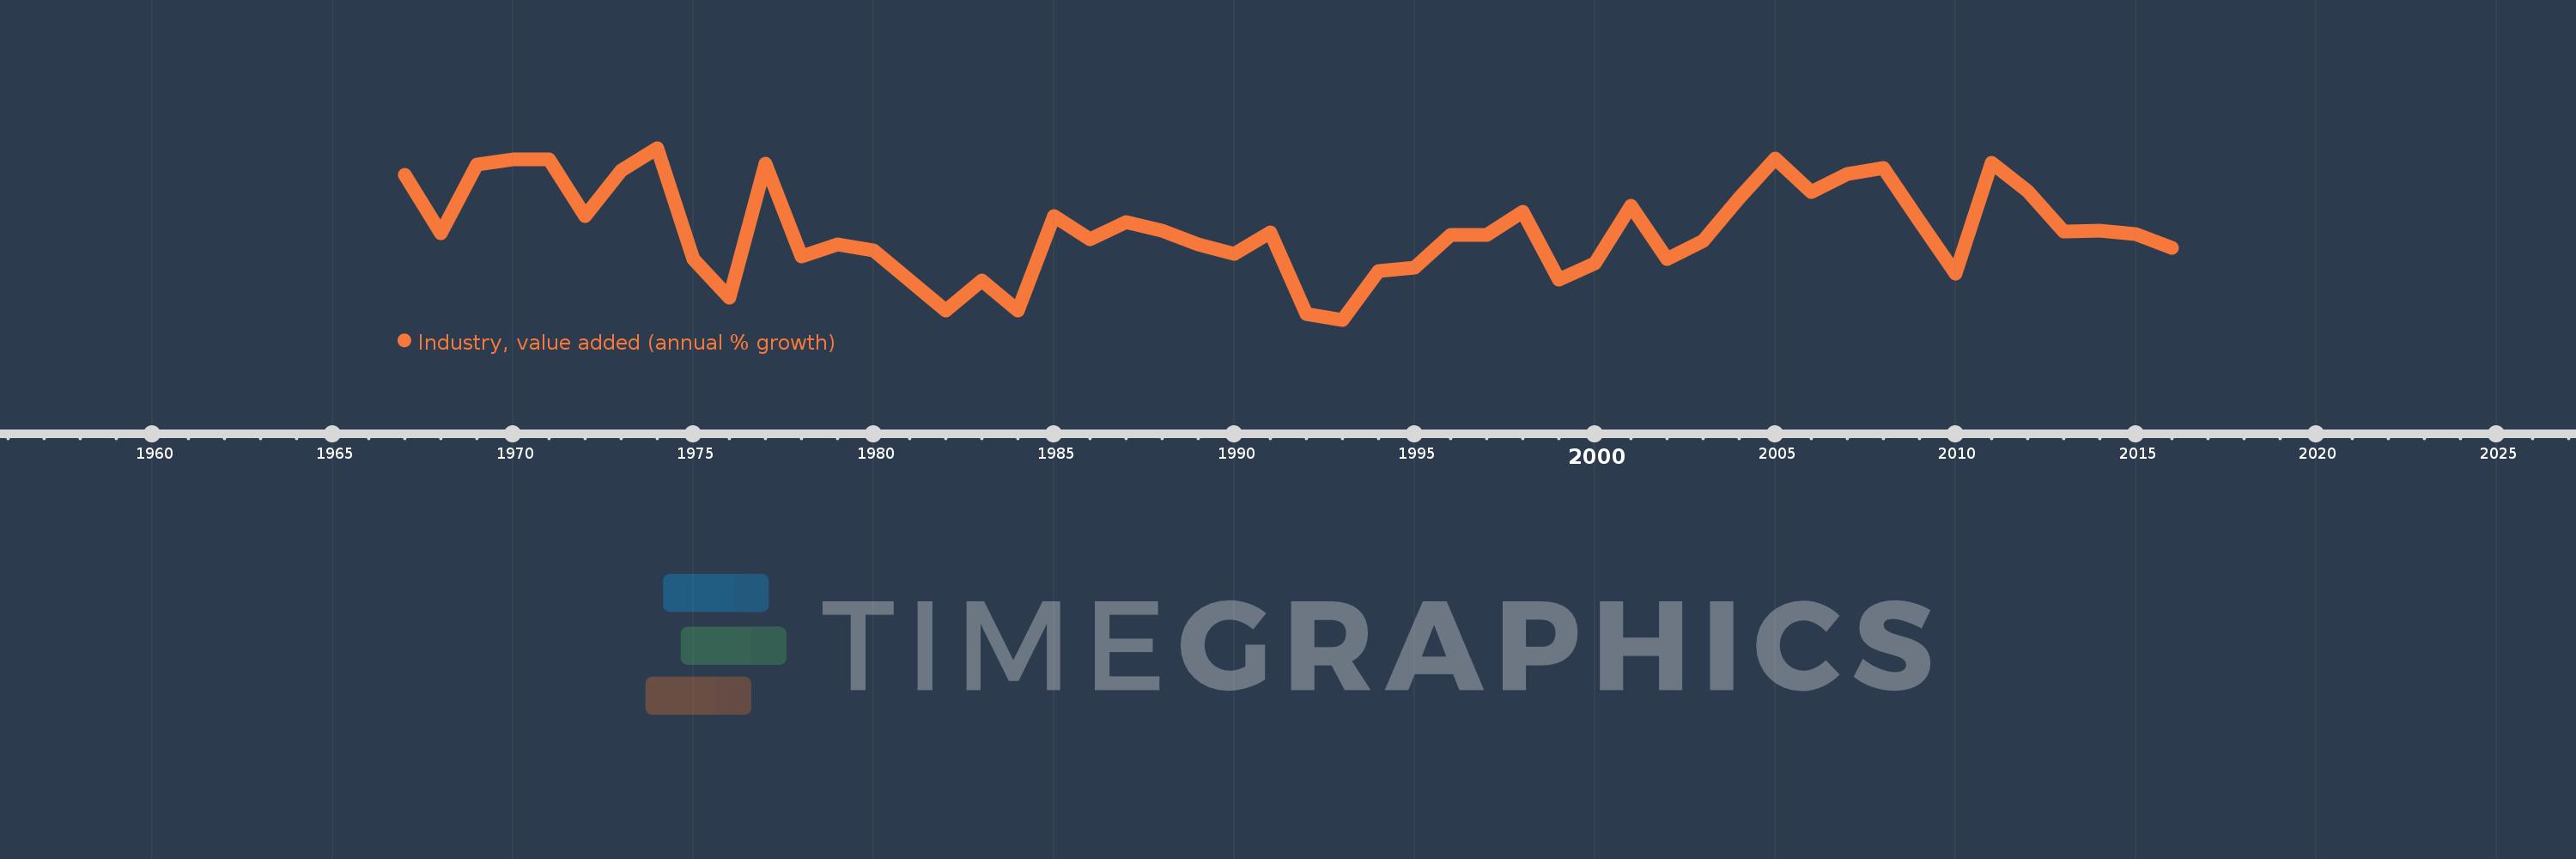
Industry, value added (annual % growth)
2016,2015,2014,2013,2012,2011,2010,2009,2008,2007,2006,2005,2004,2003,2002,2001,2000,1999,1998,1997,1996,1995,1994,1993,1992,1991,1990,1989,1988,1987,1986,1985,1984,1983,1982,1981,1980,1979,1978,1977,1976,1975,1974,1973,1972,1971,1970,1969,1968,1967
This statistics in other country:
AfghanistanAlbaniaAlgeriaAntigua and BarbudaArab WorldArgentinaArmeniaAustraliaAustriaAzerbaijanBahamas, TheBahrainBangladeshBelarusBelgiumBelizeBeninBermudaBhutanBoliviaBosnia and HerzegovinaBotswanaBrazilBrunei DarussalamBulgariaBurkina FasoBurundiCabo VerdeCambodiaCameroonCanadaCaribbean small statesCayman IslandsCentral African RepublicCentral Europe and the BalticsChadChileChinaColombiaComorosCongo, Dem. Rep.Congo, Rep.Costa RicaCote d'IvoireCroatiaCubaCyprusCzech RepublicDenmarkDjiboutiDominicaDominican RepublicEarly-demographic dividendEast Asia & PacificEast Asia & Pacific (excluding high income)East Asia & Pacific (IDA & IBRD countries)EcuadorEgypt, Arab Rep.El SalvadorEquatorial GuineaEritreaEstoniaEthiopiaEuro areaEurope & Central AsiaEurope & Central Asia (excluding high income)Europe & Central Asia (IDA & IBRD countries)European UnionFijiFinlandFragile and conflict affected situationsFranceGabonGambia, TheGeorgiaGermanyGhanaGreeceGrenadaGuatemalaGuineaGuinea-BissauGuyanaHaitiHeavily indebted poor countries (HIPC)High incomeHondurasHong Kong SAR, ChinaHungaryIBRD onlyIcelandIDA & IBRD totalIDA blendIDA onlyIDA totalIndiaIndonesiaIran, Islamic Rep.IraqIrelandItalyJamaicaJapanJordanKazakhstanKenyaKiribatiKorea, Rep.KosovoKuwaitKyrgyz RepublicLao PDRLate-demographic dividendLatin America & Caribbean Latin America & Caribbean (excluding high income)Latin America & the Caribbean (IDA & IBRD countries)LatviaLeast developed countries: UN classificationLebanonLesothoLiberiaLithuaniaLow & middle incomeLow incomeLower middle incomeLuxembourgMacedonia, FYRMadagascarMalawiMalaysiaMaldivesMaliMarshall IslandsMauritaniaMauritiusMexicoMicronesia, Fed. Sts.Middle East & North AfricaMiddle East & North Africa (excluding high income)Middle East & North Africa (IDA & IBRD countries)Middle incomeMoldovaMongoliaMontenegroMoroccoMozambiqueMyanmarNamibiaNepalNetherlandsNew ZealandNicaraguaNigerNigeriaNorth AmericaNorwayOECD membersOmanOther small statesPacific island small statesPakistanPalauPanamaPapua New GuineaParaguayPeruPhilippinesPolandPortugalPost-demographic dividendPre-demographic dividendPuerto RicoQatarRomaniaRussian FederationRwandaSamoaSao Tome and PrincipeSaudi ArabiaSenegalSerbiaSeychellesSierra LeoneSingaporeSlovak RepublicSloveniaSmall statesSolomon IslandsSomaliaSouth AfricaSouth AsiaSouth Asia (IDA & IBRD)SpainSri LankaSt. Kitts and NevisSt. LuciaSt. Vincent and the GrenadinesSub-Saharan Africa Sub-Saharan Africa (excluding high income)Sub-Saharan Africa (IDA & IBRD countries)SudanSurinameSwazilandSwedenSwitzerlandSyrian Arab RepublicTajikistanTanzaniaThailandTimor-LesteTogoTongaTrinidad and TobagoTunisiaTurkeyTurkmenistanTuvaluUgandaUkraineUnited Arab EmiratesUnited KingdomUnited StatesUpper middle incomeUruguayUzbekistanVanuatuVenezuela, RBVietnamWest Bank and GazaWorldZambiaZimbabwe Timeline:
This timeline shows a graph from 1967 to 2016 of IDA & IBRD total. No data until 1966. Number of actual observations by date: 50.
Source name:
World Development Indicators
Source organization:
World Bank national accounts data, and OECD National Accounts data files.
Categories, topics:
Economy & Growth
Last updated:
apr 23, 2017
Indicators value changes by year
Minimum:
-0.477
jan 1, 1993
At the date of observation
Value
Absolute change
Change from previous value
jan 1, 1967
7.912
+7.912
0.0%
jan 1, 1968
4.546
-3.367
-42.55%
jan 1, 1969
8.494
+3.948
86.86%
jan 1, 1970
8.777
+0.283
3.33%
jan 1, 1971
8.808
+0.031
0.36%
jan 1, 1972
5.525
-3.283
-37.27%
jan 1, 1973
8.16
+2.635
47.68%
jan 1, 1974
9.462
+1.302
15.96%
jan 1, 1975
3.056
-6.406
-67.71%
jan 1, 1976
0.805
-2.251
-73.65%
jan 1, 1977
8.568
+7.763
964.36%
jan 1, 1978
3.178
-5.39
-62.91%
jan 1, 1979
3.866
+0.688
21.64%
jan 1, 1980
3.556
-0.31
-8.01%
jan 1, 1981
1.778
-1.778
-49.99%
jan 1, 1982
0.077
-1.701
-95.66%
jan 1, 1983
1.802
+1.725
2.23K%
jan 1, 1984
0.045
-1.757
-97.49%
jan 1, 1985
5.523
+5.478
12.11K%
jan 1, 1986
4.188
-1.334
-24.16%
jan 1, 1987
5.187
+0.999
23.85%
jan 1, 1988
4.695
-0.493
-9.5%
jan 1, 1989
3.881
-0.814
-17.33%
jan 1, 1990
3.329
-0.552
-14.23%
jan 1, 1991
4.573
+1.245
37.39%
jan 1, 1992
-0.147
-4.721
-103.22%
jan 1, 1993
-0.477
-0.33
223.86%
jan 1, 1994
2.319
+2.797
-585.95%
jan 1, 1995
2.556
+0.236
10.18%
jan 1, 1996
4.439
+1.884
73.72%
jan 1, 1997
4.422
-0.018
-0.4%
jan 1, 1998
5.789
+1.367
30.92%
jan 1, 1999
1.862
-3.927
-67.84%
jan 1, 2000
2.809
+0.948
50.9%
jan 1, 2001
6.14
+3.331
118.56%
jan 1, 2002
3.026
-3.115
-50.73%
jan 1, 2003
4.09
+1.064
35.17%
jan 1, 2004
6.587
+2.497
61.06%
jan 1, 2005
8.84
+2.253
34.21%
jan 1, 2006
6.92
-1.92
-21.72%
jan 1, 2007
7.968
+1.049
15.15%
jan 1, 2008
8.293
+0.324
4.07%
jan 1, 2009
5.204
-3.089
-37.25%
jan 1, 2010
2.199
-3.005
-57.75%
jan 1, 2011
8.589
+6.39
290.6%
jan 1, 2012
6.947
-1.642
-19.12%
jan 1, 2013
4.638
-2.309
-33.24%
jan 1, 2014
4.678
+0.04
0.87%
jan 1, 2015
4.472
-0.206
-4.39%
jan 1, 2016
3.669
-0.804
-17.97%
Ranking of countries by current statistics by years


Comments: