29
/
en
AIzaSyAYiBZKx7MnpbEhh9jyipgxe19OcubqV5w
April 1, 2024
117027
Cyprus
CYP
true
2
1
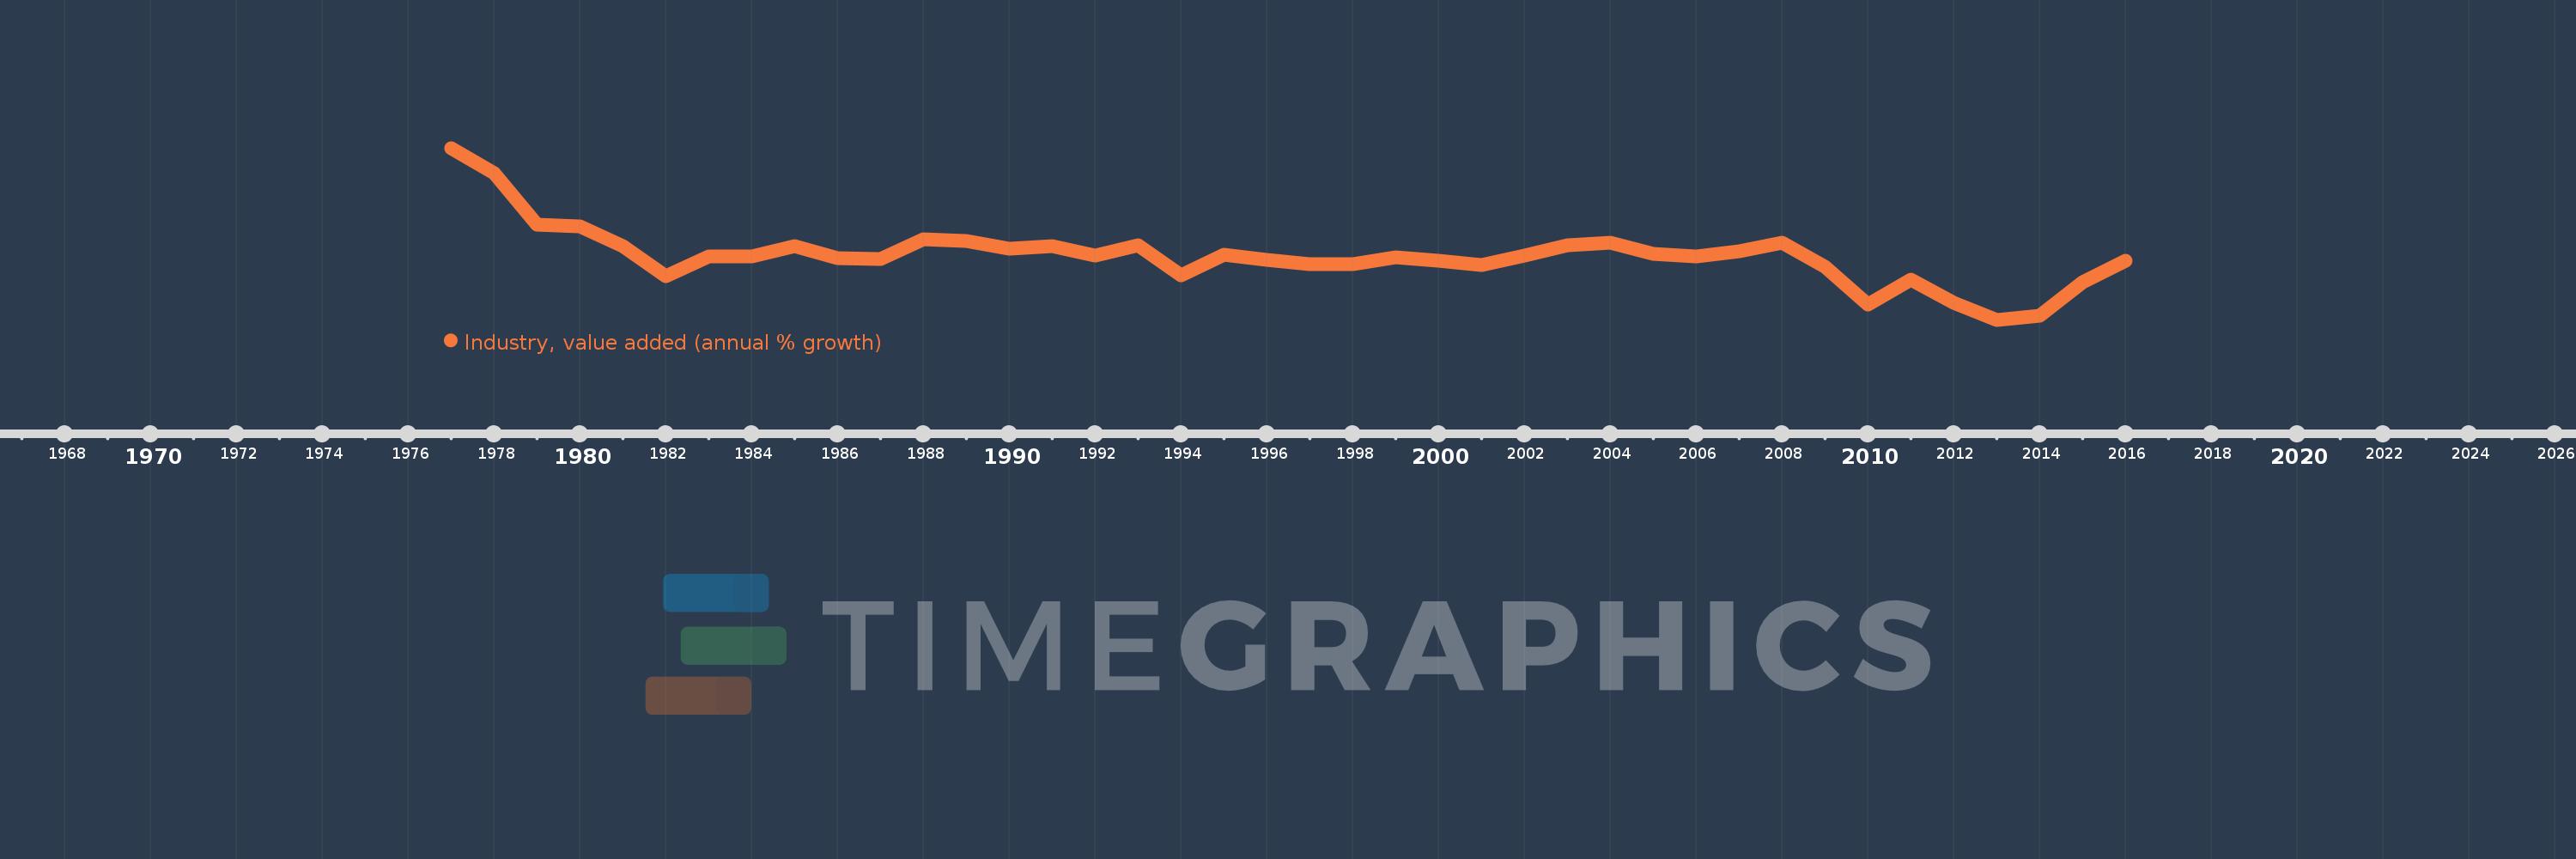
Industry, value added (annual % growth)
2016,2015,2014,2013,2012,2011,2010,2009,2008,2007,2006,2005,2004,2003,2002,2001,2000,1999,1998,1997,1996,1995,1994,1993,1992,1991,1990,1989,1988,1987,1986,1985,1984,1983,1982,1981,1980,1979,1978,1977
This statistics in other country:
AfghanistanAlbaniaAlgeriaAntigua and BarbudaArab WorldArgentinaArmeniaAustraliaAustriaAzerbaijanBahamas, TheBahrainBangladeshBelarusBelgiumBelizeBeninBermudaBhutanBoliviaBosnia and HerzegovinaBotswanaBrazilBrunei DarussalamBulgariaBurkina FasoBurundiCabo VerdeCambodiaCameroonCanadaCaribbean small statesCayman IslandsCentral African RepublicCentral Europe and the BalticsChadChileChinaColombiaComorosCongo, Dem. Rep.Congo, Rep.Costa RicaCote d'IvoireCroatiaCubaCyprusCzech RepublicDenmarkDjiboutiDominicaDominican RepublicEarly-demographic dividendEast Asia & PacificEast Asia & Pacific (excluding high income)East Asia & Pacific (IDA & IBRD countries)EcuadorEgypt, Arab Rep.El SalvadorEquatorial GuineaEritreaEstoniaEthiopiaEuro areaEurope & Central AsiaEurope & Central Asia (excluding high income)Europe & Central Asia (IDA & IBRD countries)European UnionFijiFinlandFragile and conflict affected situationsFranceGabonGambia, TheGeorgiaGermanyGhanaGreeceGrenadaGuatemalaGuineaGuinea-BissauGuyanaHaitiHeavily indebted poor countries (HIPC)High incomeHondurasHong Kong SAR, ChinaHungaryIBRD onlyIcelandIDA & IBRD totalIDA blendIDA onlyIDA totalIndiaIndonesiaIran, Islamic Rep.IraqIrelandItalyJamaicaJapanJordanKazakhstanKenyaKiribatiKorea, Rep.KosovoKuwaitKyrgyz RepublicLao PDRLate-demographic dividendLatin America & Caribbean Latin America & Caribbean (excluding high income)Latin America & the Caribbean (IDA & IBRD countries)LatviaLeast developed countries: UN classificationLebanonLesothoLiberiaLithuaniaLow & middle incomeLow incomeLower middle incomeLuxembourgMacedonia, FYRMadagascarMalawiMalaysiaMaldivesMaliMarshall IslandsMauritaniaMauritiusMexicoMicronesia, Fed. Sts.Middle East & North AfricaMiddle East & North Africa (excluding high income)Middle East & North Africa (IDA & IBRD countries)Middle incomeMoldovaMongoliaMontenegroMoroccoMozambiqueMyanmarNamibiaNepalNetherlandsNew ZealandNicaraguaNigerNigeriaNorth AmericaNorwayOECD membersOmanOther small statesPacific island small statesPakistanPalauPanamaPapua New GuineaParaguayPeruPhilippinesPolandPortugalPost-demographic dividendPre-demographic dividendPuerto RicoQatarRomaniaRussian FederationRwandaSamoaSao Tome and PrincipeSaudi ArabiaSenegalSerbiaSeychellesSierra LeoneSingaporeSlovak RepublicSloveniaSmall statesSolomon IslandsSomaliaSouth AfricaSouth AsiaSouth Asia (IDA & IBRD)SpainSri LankaSt. Kitts and NevisSt. LuciaSt. Vincent and the GrenadinesSub-Saharan Africa Sub-Saharan Africa (excluding high income)Sub-Saharan Africa (IDA & IBRD countries)SudanSurinameSwazilandSwedenSwitzerlandSyrian Arab RepublicTajikistanTanzaniaThailandTimor-LesteTogoTongaTrinidad and TobagoTunisiaTurkeyTurkmenistanTuvaluUgandaUkraineUnited Arab EmiratesUnited KingdomUnited StatesUpper middle incomeUruguayUzbekistanVanuatuVenezuela, RBVietnamWest Bank and GazaWorldZambiaZimbabwe Timeline:
This timeline shows a graph from 1977 to 2016 of Cyprus. No data until 1976. Number of actual observations by date: 40.
Source name:
World Development Indicators
Source organization:
World Bank national accounts data, and OECD National Accounts data files.
Categories, topics:
Economy & Growth
Last updated:
apr 23, 2017
Indicators value changes by year
Minimum:
-15.341
jan 1, 2013
Maximum:
31.968
jan 1, 1977
At the date of observation
Value
Absolute change
Change from previous value
jan 1, 1977
31.968
+31.968
0.0%
jan 1, 1978
24.959
-7.009
-21.92%
jan 1, 1979
10.951
-14.008
-56.12%
jan 1, 1980
10.401
-0.551
-5.03%
jan 1, 1981
4.831
-5.57
-53.56%
jan 1, 1982
-3.284
-8.115
-167.99%
jan 1, 1983
2.185
+5.469
-166.53%
jan 1, 1984
1.984
-0.201
-9.21%
jan 1, 1985
4.875
+2.891
145.78%
jan 1, 1986
1.71
-3.165
-64.92%
jan 1, 1987
1.492
-0.218
-12.76%
jan 1, 1988
6.79
+5.298
355.12%
jan 1, 1989
6.336
-0.454
-6.68%
jan 1, 1990
4.335
-2.001
-31.58%
jan 1, 1991
5.002
+0.667
15.38%
jan 1, 1992
2.232
-2.77
-55.38%
jan 1, 1993
5.063
+2.831
126.87%
jan 1, 1994
-3.16
-8.224
-162.42%
jan 1, 1995
2.669
+5.829
-184.44%
jan 1, 1996
1.127
-1.542
-57.78%
jan 1, 1997
-0.011
-1.138
-101.01%
jan 1, 1998
-0.153
-0.142
1.25K%
jan 1, 1999
1.853
+2.006
-1.31K%
jan 1, 2000
0.88
-0.973
-52.49%
jan 1, 2001
-0.306
-1.186
-134.74%
jan 1, 2002
2.328
+2.633
-861.17%
jan 1, 2003
5.154
+2.827
121.45%
jan 1, 2004
5.955
+0.8
15.53%
jan 1, 2005
2.801
-3.153
-52.95%
jan 1, 2006
2.051
-0.75
-26.78%
jan 1, 2007
3.415
+1.364
66.52%
jan 1, 2008
5.901
+2.485
72.77%
jan 1, 2009
-0.791
-6.692
-113.4%
jan 1, 2010
-11.23
-10.439
1.32K%
jan 1, 2011
-4.177
+7.053
-62.8%
jan 1, 2012
-10.692
-6.516
155.99%
jan 1, 2013
-15.341
-4.648
43.47%
jan 1, 2014
-14.323
+1.018
-6.63%
jan 1, 2015
-4.935
+9.388
-65.54%
jan 1, 2016
0.888
+5.823
-117.99%
Ranking of countries by current statistics by years


Comments: