29
/
en
AIzaSyAYiBZKx7MnpbEhh9jyipgxe19OcubqV5w
April 1, 2024
132130
Fiji
FJI
true
2
1
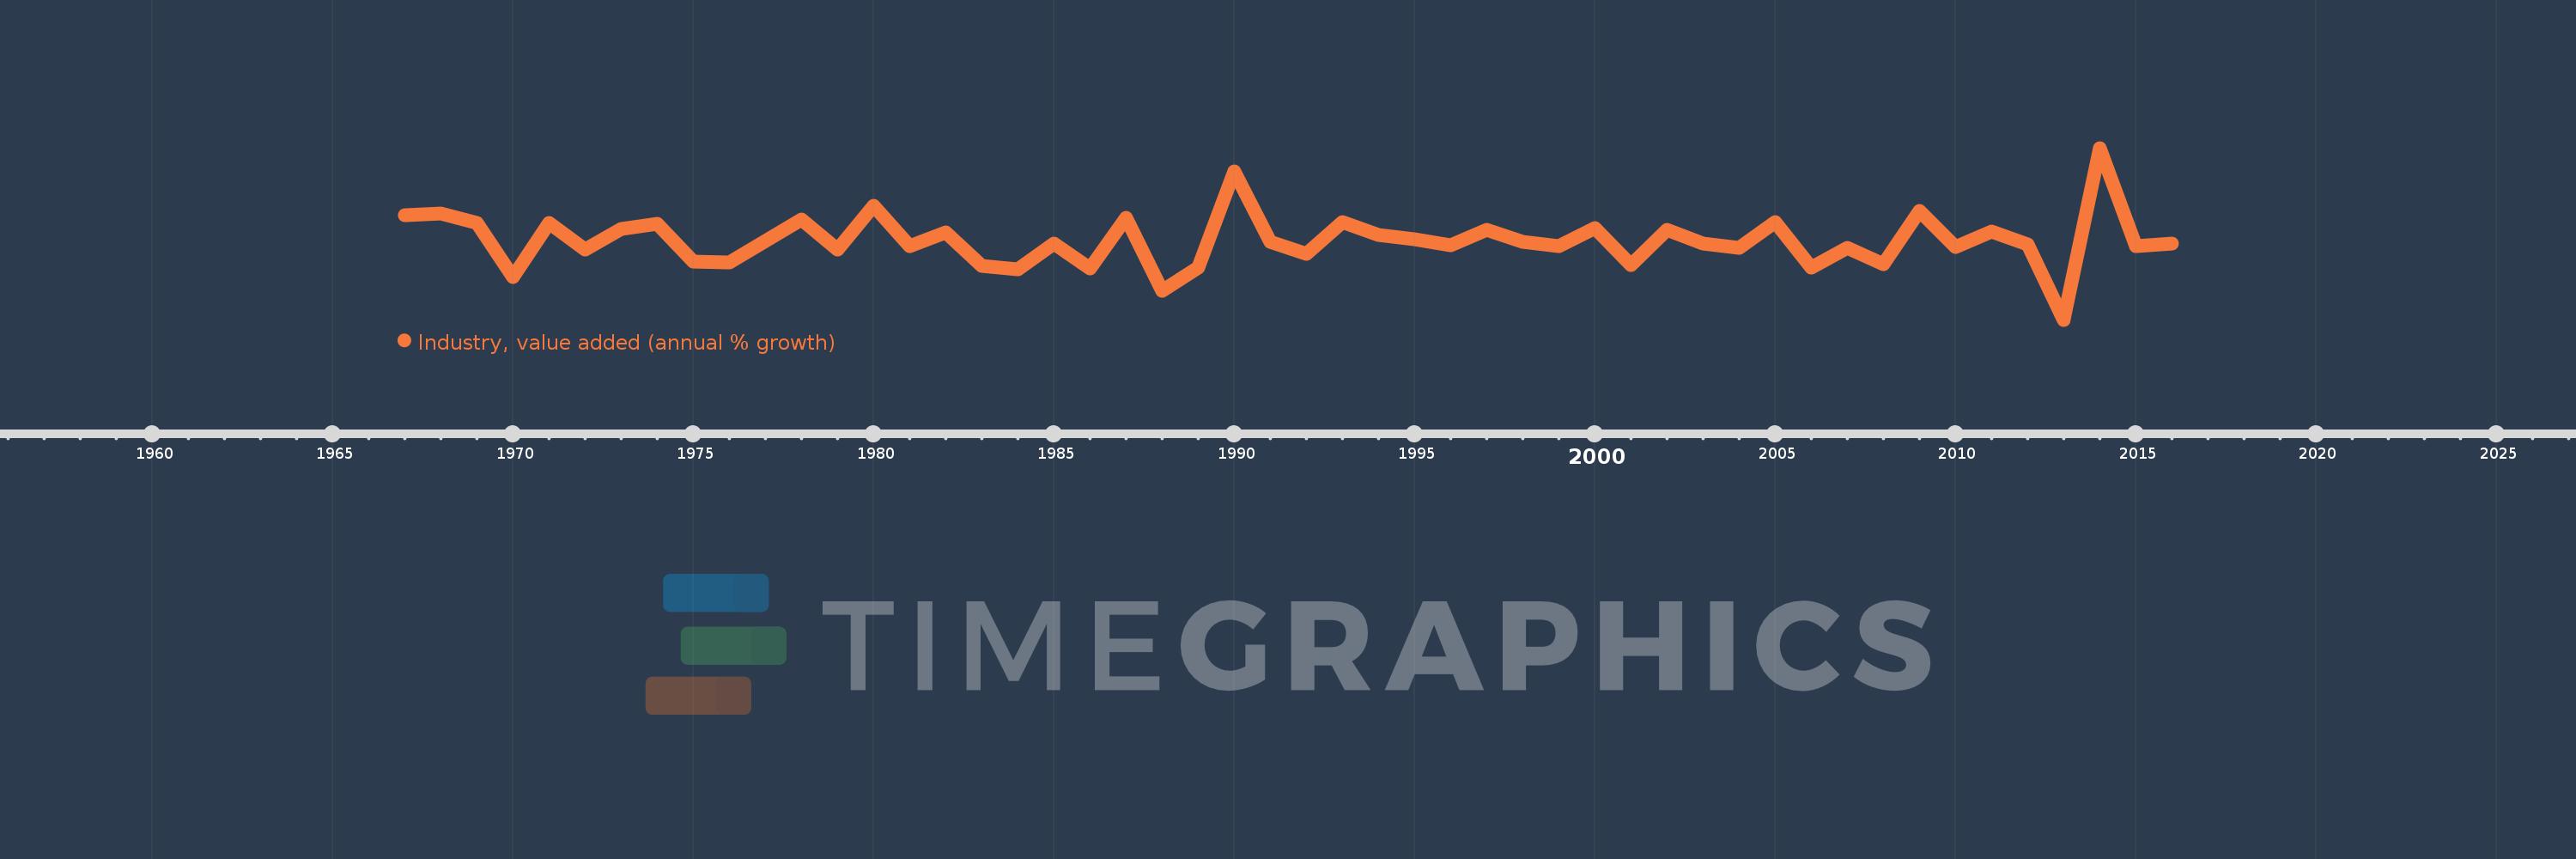
Industry, value added (annual % growth)
2016,2015,2014,2013,2012,2011,2010,2009,2008,2007,2006,2005,2004,2003,2002,2001,2000,1999,1998,1997,1996,1995,1994,1993,1992,1991,1990,1989,1988,1987,1986,1985,1984,1983,1982,1981,1980,1979,1978,1977,1976,1975,1974,1973,1972,1971,1970,1969,1968,1967
This statistics in other country:
AfghanistanAlbaniaAlgeriaAntigua and BarbudaArab WorldArgentinaArmeniaAustraliaAustriaAzerbaijanBahamas, TheBahrainBangladeshBelarusBelgiumBelizeBeninBermudaBhutanBoliviaBosnia and HerzegovinaBotswanaBrazilBrunei DarussalamBulgariaBurkina FasoBurundiCabo VerdeCambodiaCameroonCanadaCaribbean small statesCayman IslandsCentral African RepublicCentral Europe and the BalticsChadChileChinaColombiaComorosCongo, Dem. Rep.Congo, Rep.Costa RicaCote d'IvoireCroatiaCubaCyprusCzech RepublicDenmarkDjiboutiDominicaDominican RepublicEarly-demographic dividendEast Asia & PacificEast Asia & Pacific (excluding high income)East Asia & Pacific (IDA & IBRD countries)EcuadorEgypt, Arab Rep.El SalvadorEquatorial GuineaEritreaEstoniaEthiopiaEuro areaEurope & Central AsiaEurope & Central Asia (excluding high income)Europe & Central Asia (IDA & IBRD countries)European UnionFijiFinlandFragile and conflict affected situationsFranceGabonGambia, TheGeorgiaGermanyGhanaGreeceGrenadaGuatemalaGuineaGuinea-BissauGuyanaHaitiHeavily indebted poor countries (HIPC)High incomeHondurasHong Kong SAR, ChinaHungaryIBRD onlyIcelandIDA & IBRD totalIDA blendIDA onlyIDA totalIndiaIndonesiaIran, Islamic Rep.IraqIrelandItalyJamaicaJapanJordanKazakhstanKenyaKiribatiKorea, Rep.KosovoKuwaitKyrgyz RepublicLao PDRLate-demographic dividendLatin America & Caribbean Latin America & Caribbean (excluding high income)Latin America & the Caribbean (IDA & IBRD countries)LatviaLeast developed countries: UN classificationLebanonLesothoLiberiaLithuaniaLow & middle incomeLow incomeLower middle incomeLuxembourgMacedonia, FYRMadagascarMalawiMalaysiaMaldivesMaliMarshall IslandsMauritaniaMauritiusMexicoMicronesia, Fed. Sts.Middle East & North AfricaMiddle East & North Africa (excluding high income)Middle East & North Africa (IDA & IBRD countries)Middle incomeMoldovaMongoliaMontenegroMoroccoMozambiqueMyanmarNamibiaNepalNetherlandsNew ZealandNicaraguaNigerNigeriaNorth AmericaNorwayOECD membersOmanOther small statesPacific island small statesPakistanPalauPanamaPapua New GuineaParaguayPeruPhilippinesPolandPortugalPost-demographic dividendPre-demographic dividendPuerto RicoQatarRomaniaRussian FederationRwandaSamoaSao Tome and PrincipeSaudi ArabiaSenegalSerbiaSeychellesSierra LeoneSingaporeSlovak RepublicSloveniaSmall statesSolomon IslandsSomaliaSouth AfricaSouth AsiaSouth Asia (IDA & IBRD)SpainSri LankaSt. Kitts and NevisSt. LuciaSt. Vincent and the GrenadinesSub-Saharan Africa Sub-Saharan Africa (excluding high income)Sub-Saharan Africa (IDA & IBRD countries)SudanSurinameSwazilandSwedenSwitzerlandSyrian Arab RepublicTajikistanTanzaniaThailandTimor-LesteTogoTongaTrinidad and TobagoTunisiaTurkeyTurkmenistanTuvaluUgandaUkraineUnited Arab EmiratesUnited KingdomUnited StatesUpper middle incomeUruguayUzbekistanVanuatuVenezuela, RBVietnamWest Bank and GazaWorldZambiaZimbabwe Timeline:
This timeline shows a graph from 1967 to 2016 of Fiji. No data until 1966. Number of actual observations by date: 50.
Source name:
World Development Indicators
Source organization:
World Bank national accounts data, and OECD National Accounts data files.
Categories, topics:
Economy & Growth
Last updated:
apr 23, 2017
Indicators value changes by year
Minimum:
-25.636
jan 1, 2013
Maximum:
37.275
jan 1, 2014
At the date of observation
Value
Absolute change
Change from previous value
jan 1, 1967
12.597
+12.597
0.0%
jan 1, 1968
13.154
+0.556
4.42%
jan 1, 1969
9.798
-3.356
-25.52%
jan 1, 1970
-9.893
-19.691
-200.98%
jan 1, 1971
9.688
+19.581
-197.92%
jan 1, 1972
0.0
-9.688
-100.0%
jan 1, 1973
7.556
+7.556
%
jan 1, 1974
9.489
+1.933
25.58%
jan 1, 1975
-4.25
-13.739
-144.79%
jan 1, 1976
-4.787
-0.537
12.63%
jan 1, 1977
3.108
+7.895
-164.93%
jan 1, 1978
11.17
+8.062
259.42%
jan 1, 1979
-0.08
-11.25
-100.71%
jan 1, 1980
15.962
+16.041
-20.12K%
jan 1, 1981
1.376
-14.585
-91.38%
jan 1, 1982
6.314
+4.937
358.68%
jan 1, 1983
-5.875
-12.188
-193.05%
jan 1, 1984
-7.327
-1.452
24.72%
jan 1, 1985
2.123
+9.45
-128.97%
jan 1, 1986
-6.882
-9.005
-424.15%
jan 1, 1987
11.547
+18.429
-267.8%
jan 1, 1988
-15.045
-26.592
-230.29%
jan 1, 1989
-6.499
+8.546
-56.8%
jan 1, 1990
28.686
+35.185
-541.41%
jan 1, 1991
3.05
-25.636
-89.37%
jan 1, 1992
-1.588
-4.637
-152.05%
jan 1, 1993
10.174
+11.761
-740.85%
jan 1, 1994
5.54
-4.634
-45.55%
jan 1, 1995
3.937
-1.603
-28.94%
jan 1, 1996
1.72
-2.217
-56.32%
jan 1, 1997
7.406
+5.686
330.65%
jan 1, 1998
3.034
-4.371
-59.03%
jan 1, 1999
1.206
-1.828
-60.25%
jan 1, 2000
8.064
+6.858
568.56%
jan 1, 2001
-5.443
-13.506
-167.49%
jan 1, 2002
7.271
+12.713
-233.59%
jan 1, 2003
2.259
-5.011
-68.93%
jan 1, 2004
0.842
-1.417
-62.72%
jan 1, 2005
10.023
+9.181
1.09K%
jan 1, 2006
-6.633
-16.657
-166.18%
jan 1, 2007
0.663
+7.297
-110.0%
jan 1, 2008
-5.152
-5.815
-876.67%
jan 1, 2009
14.086
+19.237
-373.43%
jan 1, 2010
1.043
-13.043
-92.6%
jan 1, 2011
6.533
+5.49
526.43%
jan 1, 2012
1.984
-4.549
-69.63%
jan 1, 2013
-25.636
-27.62
-1.39K%
jan 1, 2014
37.275
+62.911
-245.4%
jan 1, 2015
1.179
-36.096
-96.84%
jan 1, 2016
2.169
+0.99
83.98%
Ranking of countries by current statistics by years


Comments: