29
/
en
AIzaSyAYiBZKx7MnpbEhh9jyipgxe19OcubqV5w
April 1, 2024
177801
Lesotho
LSO
true
2
1
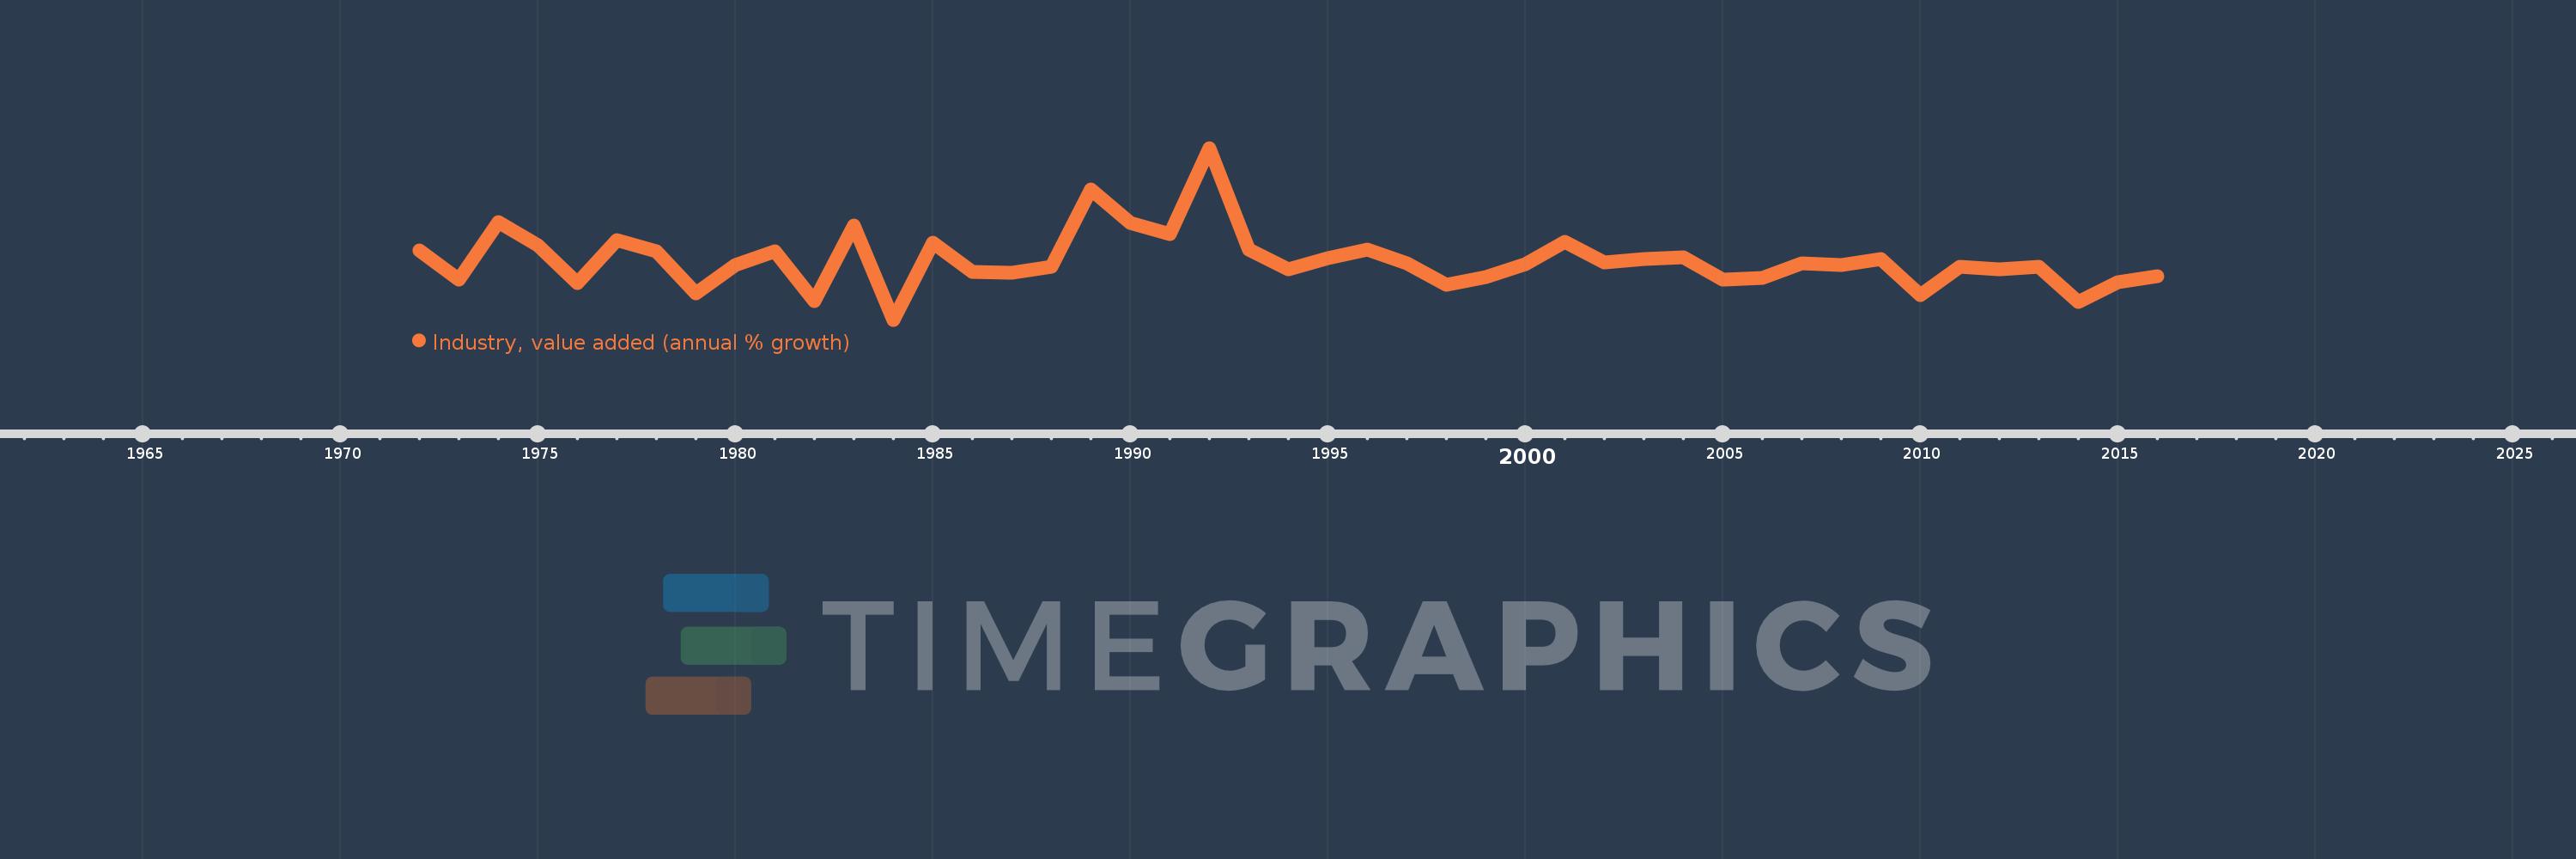
Industry, value added (annual % growth)
2016,2015,2014,2013,2012,2011,2010,2009,2008,2007,2006,2005,2004,2003,2002,2001,2000,1999,1998,1997,1996,1995,1994,1993,1992,1991,1990,1989,1988,1987,1986,1985,1984,1983,1982,1981,1980,1979,1978,1977,1976,1975,1974,1973,1972
This statistics in other country:
AfghanistanAlbaniaAlgeriaAntigua and BarbudaArab WorldArgentinaArmeniaAustraliaAustriaAzerbaijanBahamas, TheBahrainBangladeshBelarusBelgiumBelizeBeninBermudaBhutanBoliviaBosnia and HerzegovinaBotswanaBrazilBrunei DarussalamBulgariaBurkina FasoBurundiCabo VerdeCambodiaCameroonCanadaCaribbean small statesCayman IslandsCentral African RepublicCentral Europe and the BalticsChadChileChinaColombiaComorosCongo, Dem. Rep.Congo, Rep.Costa RicaCote d'IvoireCroatiaCubaCyprusCzech RepublicDenmarkDjiboutiDominicaDominican RepublicEarly-demographic dividendEast Asia & PacificEast Asia & Pacific (excluding high income)East Asia & Pacific (IDA & IBRD countries)EcuadorEgypt, Arab Rep.El SalvadorEquatorial GuineaEritreaEstoniaEthiopiaEuro areaEurope & Central AsiaEurope & Central Asia (excluding high income)Europe & Central Asia (IDA & IBRD countries)European UnionFijiFinlandFragile and conflict affected situationsFranceGabonGambia, TheGeorgiaGermanyGhanaGreeceGrenadaGuatemalaGuineaGuinea-BissauGuyanaHaitiHeavily indebted poor countries (HIPC)High incomeHondurasHong Kong SAR, ChinaHungaryIBRD onlyIcelandIDA & IBRD totalIDA blendIDA onlyIDA totalIndiaIndonesiaIran, Islamic Rep.IraqIrelandItalyJamaicaJapanJordanKazakhstanKenyaKiribatiKorea, Rep.KosovoKuwaitKyrgyz RepublicLao PDRLate-demographic dividendLatin America & Caribbean Latin America & Caribbean (excluding high income)Latin America & the Caribbean (IDA & IBRD countries)LatviaLeast developed countries: UN classificationLebanonLesothoLiberiaLithuaniaLow & middle incomeLow incomeLower middle incomeLuxembourgMacedonia, FYRMadagascarMalawiMalaysiaMaldivesMaliMarshall IslandsMauritaniaMauritiusMexicoMicronesia, Fed. Sts.Middle East & North AfricaMiddle East & North Africa (excluding high income)Middle East & North Africa (IDA & IBRD countries)Middle incomeMoldovaMongoliaMontenegroMoroccoMozambiqueMyanmarNamibiaNepalNetherlandsNew ZealandNicaraguaNigerNigeriaNorth AmericaNorwayOECD membersOmanOther small statesPacific island small statesPakistanPalauPanamaPapua New GuineaParaguayPeruPhilippinesPolandPortugalPost-demographic dividendPre-demographic dividendPuerto RicoQatarRomaniaRussian FederationRwandaSamoaSao Tome and PrincipeSaudi ArabiaSenegalSerbiaSeychellesSierra LeoneSingaporeSlovak RepublicSloveniaSmall statesSolomon IslandsSomaliaSouth AfricaSouth AsiaSouth Asia (IDA & IBRD)SpainSri LankaSt. Kitts and NevisSt. LuciaSt. Vincent and the GrenadinesSub-Saharan Africa Sub-Saharan Africa (excluding high income)Sub-Saharan Africa (IDA & IBRD countries)SudanSurinameSwazilandSwedenSwitzerlandSyrian Arab RepublicTajikistanTanzaniaThailandTimor-LesteTogoTongaTrinidad and TobagoTunisiaTurkeyTurkmenistanTuvaluUgandaUkraineUnited Arab EmiratesUnited KingdomUnited StatesUpper middle incomeUruguayUzbekistanVanuatuVenezuela, RBVietnamWest Bank and GazaWorldZambiaZimbabwe Timeline:
This timeline shows a graph from 1972 to 2016 of Lesotho. No data until 1971. Number of actual observations by date: 45.
Source name:
World Development Indicators
Source organization:
World Bank national accounts data, and OECD National Accounts data files.
Categories, topics:
Economy & Growth
Last updated:
apr 23, 2017
Indicators value changes by year
Minimum:
-15.987
jan 1, 1984
Maximum:
53.334
jan 1, 1992
At the date of observation
Value
Absolute change
Change from previous value
jan 1, 1972
11.813
+11.813
0.0%
jan 1, 1973
0.33
-11.483
-97.2%
jan 1, 1974
23.41
+23.08
6.99K%
jan 1, 1975
14.033
-9.377
-40.06%
jan 1, 1976
-1.246
-15.279
-108.88%
jan 1, 1977
16.162
+17.408
-1.4K%
jan 1, 1978
11.641
-4.52
-27.97%
jan 1, 1979
-5.187
-16.828
-144.56%
jan 1, 1980
6.087
+11.274
-217.35%
jan 1, 1981
11.562
+5.475
89.94%
jan 1, 1982
-8.3
-19.862
-171.79%
jan 1, 1983
21.87
+30.17
-363.48%
jan 1, 1984
-15.987
-37.857
-173.1%
jan 1, 1985
15.245
+31.232
-195.36%
jan 1, 1986
3.308
-11.937
-78.3%
jan 1, 1987
3.036
-0.272
-8.23%
jan 1, 1988
5.533
+2.497
82.23%
jan 1, 1989
36.66
+31.127
562.58%
jan 1, 1990
23.156
-13.505
-36.84%
jan 1, 1991
18.611
-4.545
-19.63%
jan 1, 1992
53.334
+34.723
186.57%
jan 1, 1993
12.371
-40.963
-76.81%
jan 1, 1994
4.245
-8.126
-65.69%
jan 1, 1995
8.77
+4.526
106.62%
jan 1, 1996
12.402
+3.632
41.41%
jan 1, 1997
6.82
-5.582
-45.01%
jan 1, 1998
-1.954
-8.775
-128.65%
jan 1, 1999
1.374
+3.329
-170.32%
jan 1, 2000
6.576
+5.202
378.5%
jan 1, 2001
15.299
+8.723
132.64%
jan 1, 2002
7.218
-8.08
-52.82%
jan 1, 2003
8.384
+1.166
16.15%
jan 1, 2004
9.244
+0.859
10.25%
jan 1, 2005
0.311
-8.933
-96.64%
jan 1, 2006
0.833
+0.522
167.93%
jan 1, 2007
6.661
+5.828
699.61%
jan 1, 2008
6.156
-0.504
-7.57%
jan 1, 2009
8.52
+2.363
38.39%
jan 1, 2010
-6.07
-14.589
-171.24%
jan 1, 2011
5.54
+11.61
-191.28%
jan 1, 2012
4.38
-1.16
-20.94%
jan 1, 2013
5.252
+0.872
19.9%
jan 1, 2014
-8.963
-14.215
-270.65%
jan 1, 2015
-0.819
+8.143
-90.86%
jan 1, 2016
1.57
+2.389
-291.63%
Ranking of countries by current statistics by years


Comments: