29
/
en
AIzaSyAYiBZKx7MnpbEhh9jyipgxe19OcubqV5w
April 1, 2024
208078
Netherlands
NLD
true
2
1
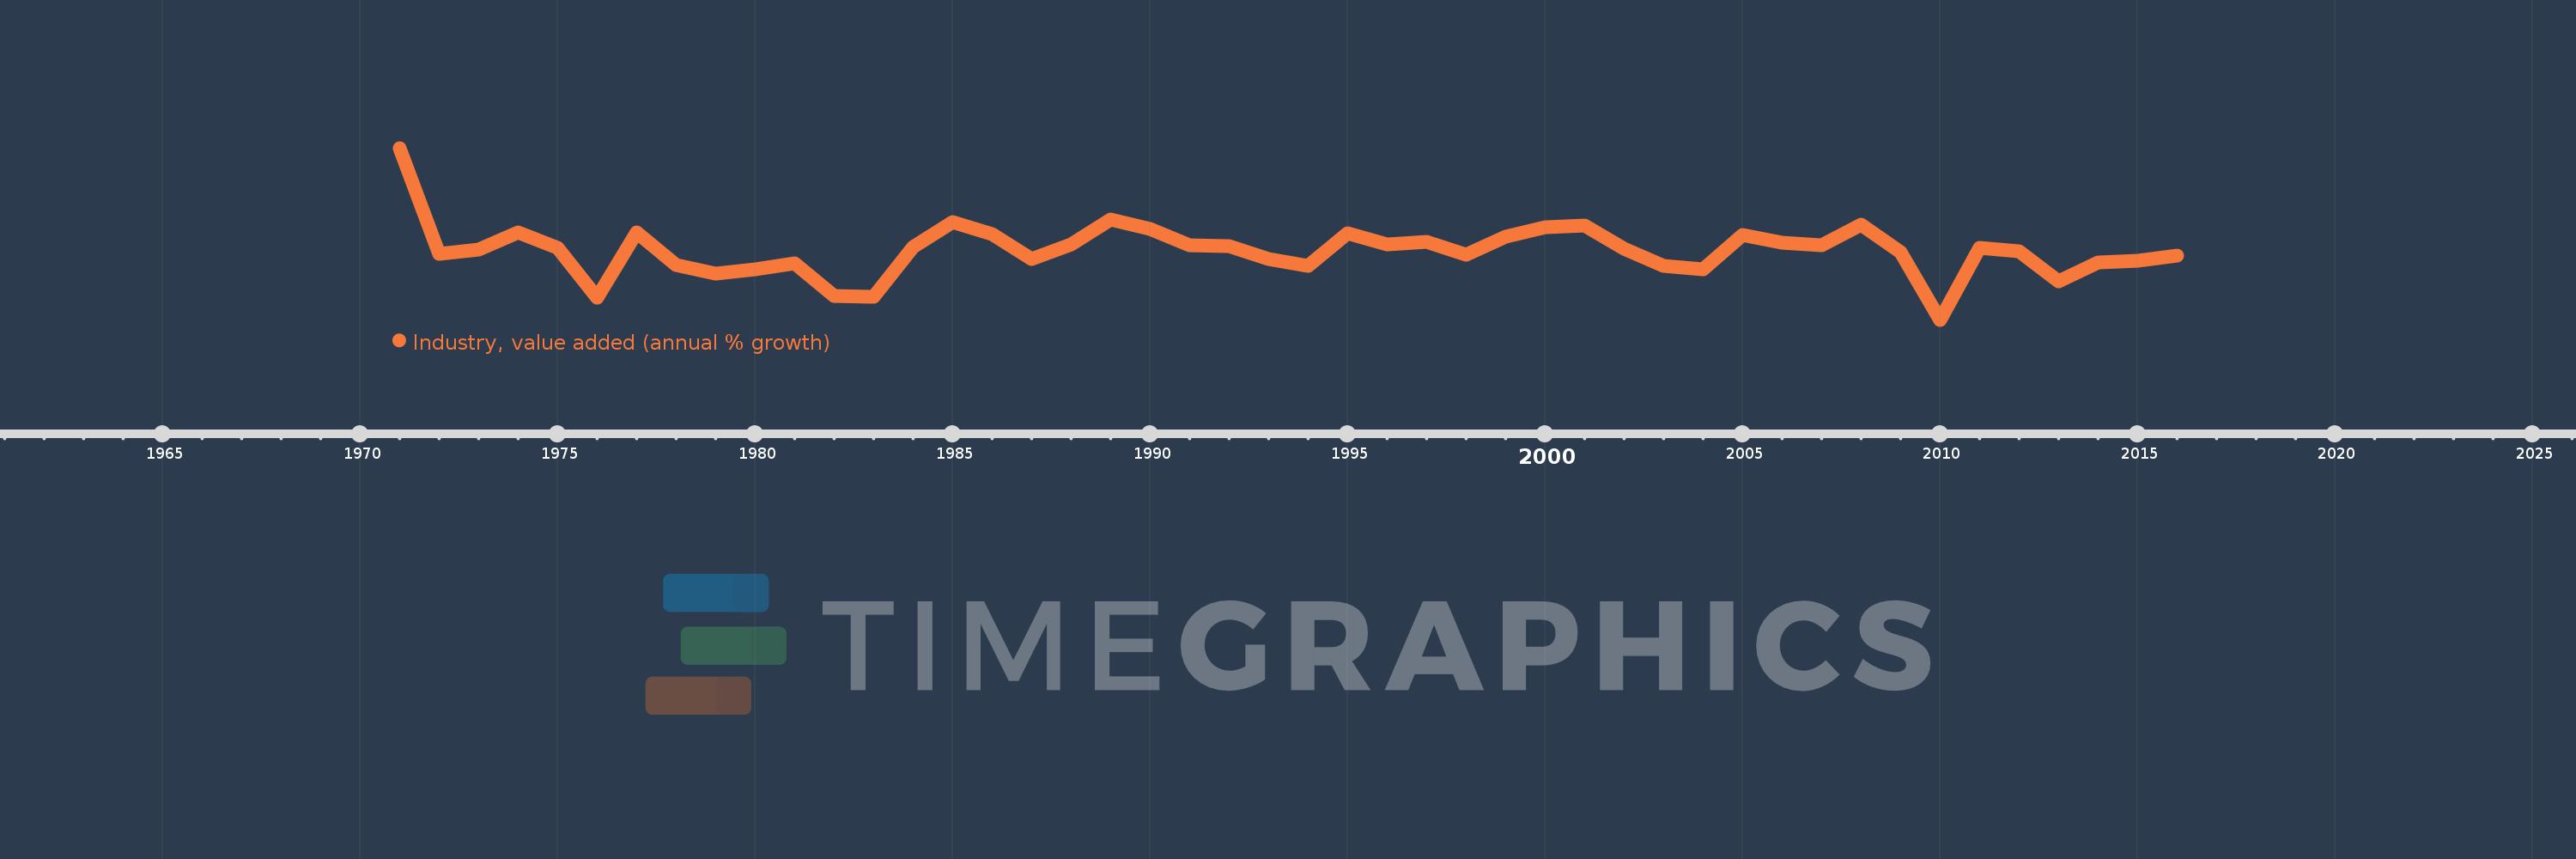
Industry, value added (annual % growth)
2016,2015,2014,2013,2012,2011,2010,2009,2008,2007,2006,2005,2004,2003,2002,2001,2000,1999,1998,1997,1996,1995,1994,1993,1992,1991,1990,1989,1988,1987,1986,1985,1984,1983,1982,1981,1980,1979,1978,1977,1976,1975,1974,1973,1972,1971
This statistics in other country:
AfghanistanAlbaniaAlgeriaAntigua and BarbudaArab WorldArgentinaArmeniaAustraliaAustriaAzerbaijanBahamas, TheBahrainBangladeshBelarusBelgiumBelizeBeninBermudaBhutanBoliviaBosnia and HerzegovinaBotswanaBrazilBrunei DarussalamBulgariaBurkina FasoBurundiCabo VerdeCambodiaCameroonCanadaCaribbean small statesCayman IslandsCentral African RepublicCentral Europe and the BalticsChadChileChinaColombiaComorosCongo, Dem. Rep.Congo, Rep.Costa RicaCote d'IvoireCroatiaCubaCyprusCzech RepublicDenmarkDjiboutiDominicaDominican RepublicEarly-demographic dividendEast Asia & PacificEast Asia & Pacific (excluding high income)East Asia & Pacific (IDA & IBRD countries)EcuadorEgypt, Arab Rep.El SalvadorEquatorial GuineaEritreaEstoniaEthiopiaEuro areaEurope & Central AsiaEurope & Central Asia (excluding high income)Europe & Central Asia (IDA & IBRD countries)European UnionFijiFinlandFragile and conflict affected situationsFranceGabonGambia, TheGeorgiaGermanyGhanaGreeceGrenadaGuatemalaGuineaGuinea-BissauGuyanaHaitiHeavily indebted poor countries (HIPC)High incomeHondurasHong Kong SAR, ChinaHungaryIBRD onlyIcelandIDA & IBRD totalIDA blendIDA onlyIDA totalIndiaIndonesiaIran, Islamic Rep.IraqIrelandItalyJamaicaJapanJordanKazakhstanKenyaKiribatiKorea, Rep.KosovoKuwaitKyrgyz RepublicLao PDRLate-demographic dividendLatin America & Caribbean Latin America & Caribbean (excluding high income)Latin America & the Caribbean (IDA & IBRD countries)LatviaLeast developed countries: UN classificationLebanonLesothoLiberiaLithuaniaLow & middle incomeLow incomeLower middle incomeLuxembourgMacedonia, FYRMadagascarMalawiMalaysiaMaldivesMaliMarshall IslandsMauritaniaMauritiusMexicoMicronesia, Fed. Sts.Middle East & North AfricaMiddle East & North Africa (excluding high income)Middle East & North Africa (IDA & IBRD countries)Middle incomeMoldovaMongoliaMontenegroMoroccoMozambiqueMyanmarNamibiaNepalNetherlandsNew ZealandNicaraguaNigerNigeriaNorth AmericaNorwayOECD membersOmanOther small statesPacific island small statesPakistanPalauPanamaPapua New GuineaParaguayPeruPhilippinesPolandPortugalPost-demographic dividendPre-demographic dividendPuerto RicoQatarRomaniaRussian FederationRwandaSamoaSao Tome and PrincipeSaudi ArabiaSenegalSerbiaSeychellesSierra LeoneSingaporeSlovak RepublicSloveniaSmall statesSolomon IslandsSomaliaSouth AfricaSouth AsiaSouth Asia (IDA & IBRD)SpainSri LankaSt. Kitts and NevisSt. LuciaSt. Vincent and the GrenadinesSub-Saharan Africa Sub-Saharan Africa (excluding high income)Sub-Saharan Africa (IDA & IBRD countries)SudanSurinameSwazilandSwedenSwitzerlandSyrian Arab RepublicTajikistanTanzaniaThailandTimor-LesteTogoTongaTrinidad and TobagoTunisiaTurkeyTurkmenistanTuvaluUgandaUkraineUnited Arab EmiratesUnited KingdomUnited StatesUpper middle incomeUruguayUzbekistanVanuatuVenezuela, RBVietnamWest Bank and GazaWorldZambiaZimbabwe Timeline:
This timeline shows a graph from 1971 to 2016 of Netherlands. No data until 1970. Number of actual observations by date: 46.
Source name:
World Development Indicators
Source organization:
World Bank national accounts data, and OECD National Accounts data files.
Categories, topics:
Economy & Growth
Last updated:
apr 23, 2017
Indicators value changes by year
Minimum:
-7.736
jan 1, 2010
Maximum:
14.189
jan 1, 1971
At the date of observation
Value
Absolute change
Change from previous value
jan 1, 1971
14.189
+14.189
0.0%
jan 1, 1972
0.684
-13.504
-95.18%
jan 1, 1973
1.243
+0.558
81.59%
jan 1, 1974
3.458
+2.215
178.25%
jan 1, 1975
1.43
-2.029
-58.67%
jan 1, 1976
-4.972
-6.402
-447.84%
jan 1, 1977
3.46
+8.432
-169.58%
jan 1, 1978
-0.806
-4.265
-123.29%
jan 1, 1979
-1.861
-1.055
131.02%
jan 1, 1980
-1.353
+0.509
-27.32%
jan 1, 1981
-0.504
+0.848
-62.73%
jan 1, 1982
-4.711
-4.207
834.43%
jan 1, 1983
-4.8
-0.089
1.9%
jan 1, 1984
1.542
+6.342
-132.12%
jan 1, 1985
4.707
+3.165
205.33%
jan 1, 1986
3.24
-1.467
-31.17%
jan 1, 1987
0.0
-3.24
-99.99%
jan 1, 1988
1.915
+1.915
1.12 mln%
jan 1, 1989
5.015
+3.1
161.9%
jan 1, 1990
3.878
-1.136
-22.66%
jan 1, 1991
1.716
-2.162
-55.74%
jan 1, 1992
1.622
-0.095
-5.51%
jan 1, 1993
-0.034
-1.656
-102.1%
jan 1, 1994
-0.855
-0.821
2.41K%
jan 1, 1995
3.325
+4.179
-488.9%
jan 1, 1996
1.855
-1.469
-44.2%
jan 1, 1997
2.196
+0.341
18.37%
jan 1, 1998
0.597
-1.599
-72.81%
jan 1, 1999
2.863
+2.265
379.35%
jan 1, 2000
4.058
+1.195
41.76%
jan 1, 2001
4.313
+0.255
6.28%
jan 1, 2002
1.366
-2.947
-68.33%
jan 1, 2003
-0.898
-2.264
-165.72%
jan 1, 2004
-1.351
-0.453
50.47%
jan 1, 2005
3.032
+4.383
-324.43%
jan 1, 2006
2.123
-0.908
-29.96%
jan 1, 2007
1.784
-0.339
-15.97%
jan 1, 2008
4.418
+2.634
147.62%
jan 1, 2009
0.86
-3.558
-80.54%
jan 1, 2010
-7.736
-8.595
-999.8%
jan 1, 2011
1.456
+9.191
-118.82%
jan 1, 2012
1.016
-0.44
-30.2%
jan 1, 2013
-2.89
-3.906
-384.45%
jan 1, 2014
-0.401
+2.489
-86.12%
jan 1, 2015
-0.173
+0.228
-56.84%
jan 1, 2016
0.481
+0.654
-377.44%
Ranking of countries by current statistics by years


Comments: