29
/
en
AIzaSyAYiBZKx7MnpbEhh9jyipgxe19OcubqV5w
April 1, 2024
108656
Comoros
COM
true
2
1
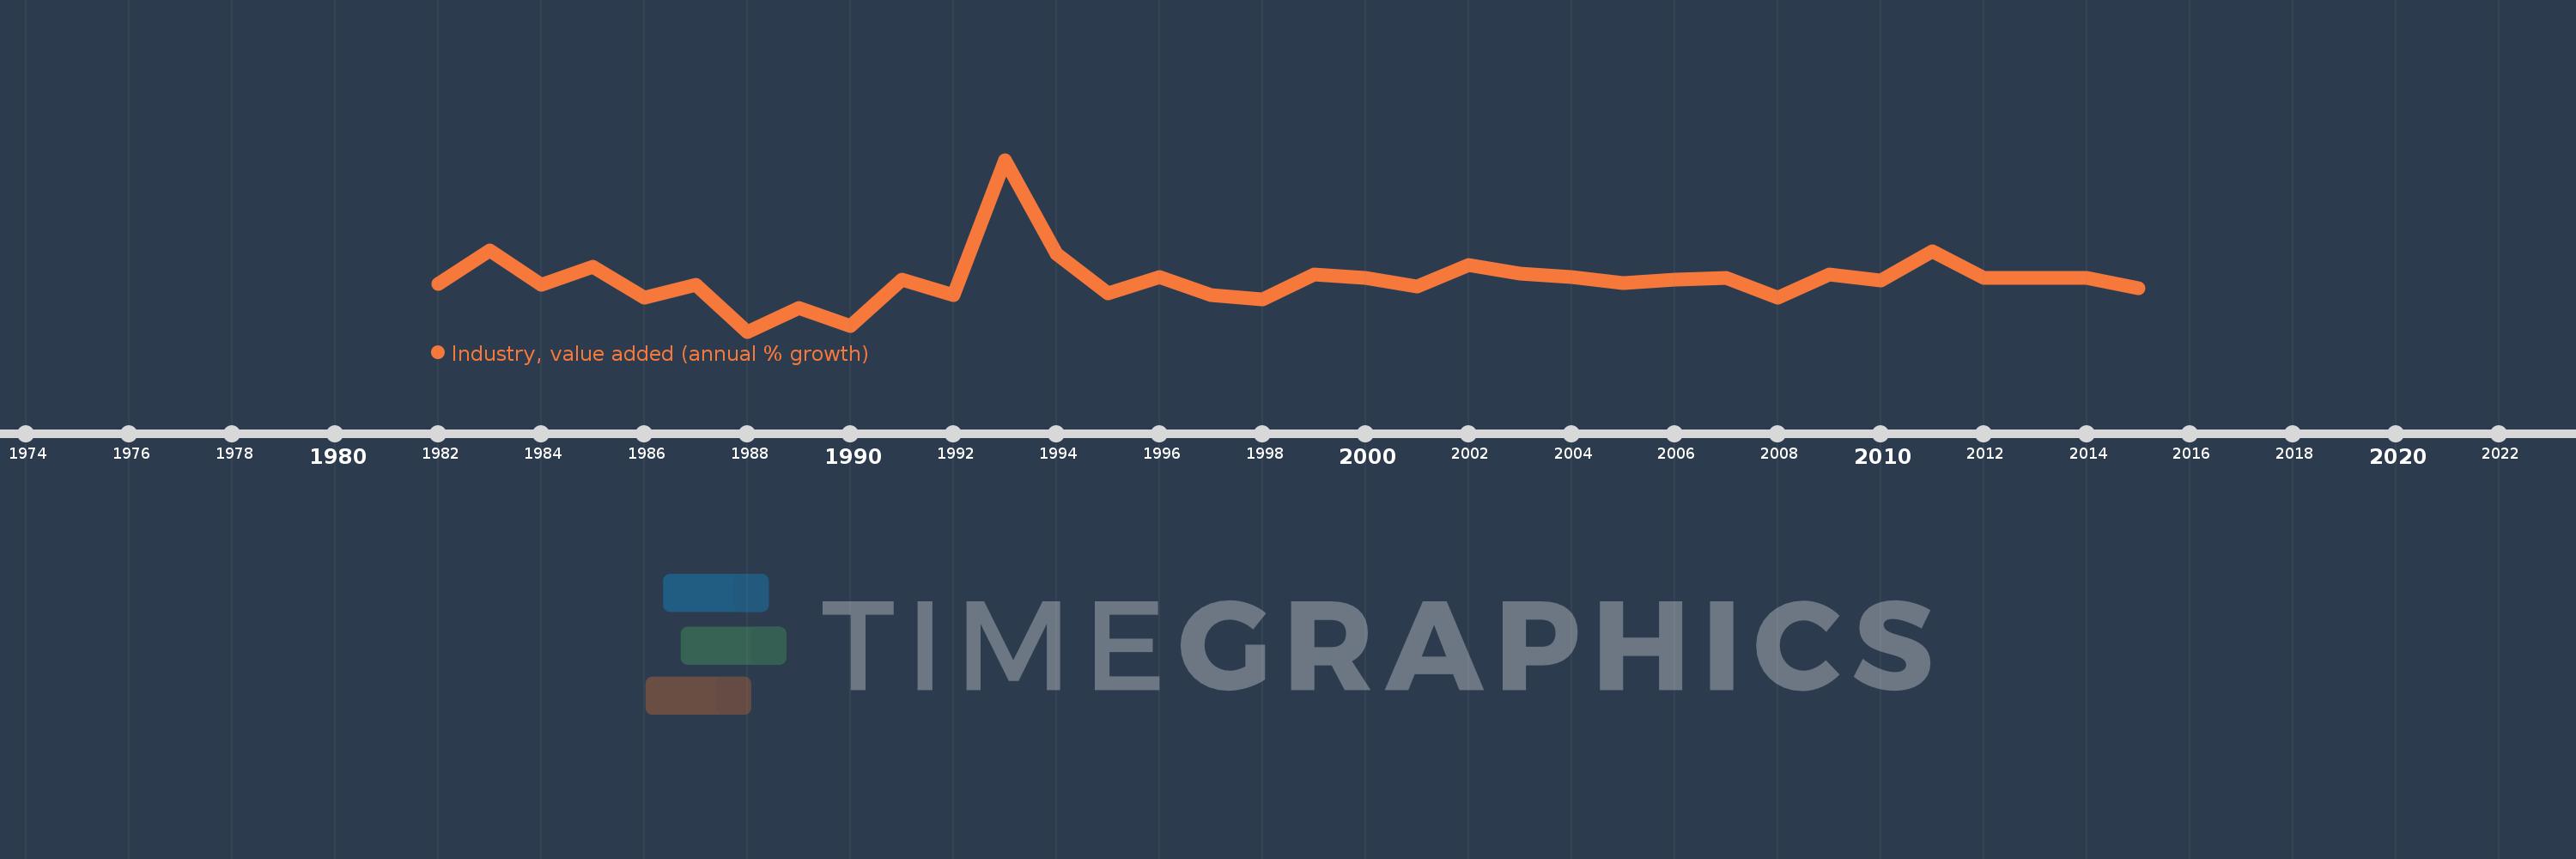
Industry, value added (annual % growth)
2015,2014,2013,2012,2011,2010,2009,2008,2007,2006,2005,2004,2003,2002,2001,2000,1999,1998,1997,1996,1995,1994,1993,1992,1991,1990,1989,1988,1987,1986,1985,1984,1983,1982
This statistics in other country:
AfghanistanAlbaniaAlgeriaAntigua and BarbudaArab WorldArgentinaArmeniaAustraliaAustriaAzerbaijanBahamas, TheBahrainBangladeshBelarusBelgiumBelizeBeninBermudaBhutanBoliviaBosnia and HerzegovinaBotswanaBrazilBrunei DarussalamBulgariaBurkina FasoBurundiCabo VerdeCambodiaCameroonCanadaCaribbean small statesCayman IslandsCentral African RepublicCentral Europe and the BalticsChadChileChinaColombiaComorosCongo, Dem. Rep.Congo, Rep.Costa RicaCote d'IvoireCroatiaCubaCyprusCzech RepublicDenmarkDjiboutiDominicaDominican RepublicEarly-demographic dividendEast Asia & PacificEast Asia & Pacific (excluding high income)East Asia & Pacific (IDA & IBRD countries)EcuadorEgypt, Arab Rep.El SalvadorEquatorial GuineaEritreaEstoniaEthiopiaEuro areaEurope & Central AsiaEurope & Central Asia (excluding high income)Europe & Central Asia (IDA & IBRD countries)European UnionFijiFinlandFragile and conflict affected situationsFranceGabonGambia, TheGeorgiaGermanyGhanaGreeceGrenadaGuatemalaGuineaGuinea-BissauGuyanaHaitiHeavily indebted poor countries (HIPC)High incomeHondurasHong Kong SAR, ChinaHungaryIBRD onlyIcelandIDA & IBRD totalIDA blendIDA onlyIDA totalIndiaIndonesiaIran, Islamic Rep.IraqIrelandItalyJamaicaJapanJordanKazakhstanKenyaKiribatiKorea, Rep.KosovoKuwaitKyrgyz RepublicLao PDRLate-demographic dividendLatin America & Caribbean Latin America & Caribbean (excluding high income)Latin America & the Caribbean (IDA & IBRD countries)LatviaLeast developed countries: UN classificationLebanonLesothoLiberiaLithuaniaLow & middle incomeLow incomeLower middle incomeLuxembourgMacedonia, FYRMadagascarMalawiMalaysiaMaldivesMaliMarshall IslandsMauritaniaMauritiusMexicoMicronesia, Fed. Sts.Middle East & North AfricaMiddle East & North Africa (excluding high income)Middle East & North Africa (IDA & IBRD countries)Middle incomeMoldovaMongoliaMontenegroMoroccoMozambiqueMyanmarNamibiaNepalNetherlandsNew ZealandNicaraguaNigerNigeriaNorth AmericaNorwayOECD membersOmanOther small statesPacific island small statesPakistanPalauPanamaPapua New GuineaParaguayPeruPhilippinesPolandPortugalPost-demographic dividendPre-demographic dividendPuerto RicoQatarRomaniaRussian FederationRwandaSamoaSao Tome and PrincipeSaudi ArabiaSenegalSerbiaSeychellesSierra LeoneSingaporeSlovak RepublicSloveniaSmall statesSolomon IslandsSomaliaSouth AfricaSouth AsiaSouth Asia (IDA & IBRD)SpainSri LankaSt. Kitts and NevisSt. LuciaSt. Vincent and the GrenadinesSub-Saharan Africa Sub-Saharan Africa (excluding high income)Sub-Saharan Africa (IDA & IBRD countries)SudanSurinameSwazilandSwedenSwitzerlandSyrian Arab RepublicTajikistanTanzaniaThailandTimor-LesteTogoTongaTrinidad and TobagoTunisiaTurkeyTurkmenistanTuvaluUgandaUkraineUnited Arab EmiratesUnited KingdomUnited StatesUpper middle incomeUruguayUzbekistanVanuatuVenezuela, RBVietnamWest Bank and GazaWorldZambiaZimbabwe Timeline:
This timeline shows a graph from 1982 to 2015 of Comoros. No data until 1981. Number of actual observations by date: 34.
Source name:
World Development Indicators
Source organization:
World Bank national accounts data, and OECD National Accounts data files.
Categories, topics:
Economy & Growth
Last updated:
apr 23, 2017
Indicators value changes by year
Maximum:
46.335
jan 1, 1993
At the date of observation
Value
Absolute change
Change from previous value
jan 1, 1982
0.884
+0.884
0.0%
jan 1, 1983
12.938
+12.054
1.36K%
jan 1, 1984
0.628
-12.31
-95.14%
jan 1, 1985
6.978
+6.349
1.01K%
jan 1, 1986
-4.108
-11.086
-158.87%
jan 1, 1987
0.322
+4.43
-107.84%
jan 1, 1988
-16.7
-17.023
-5.28K%
jan 1, 1989
-8.011
+8.689
-52.03%
jan 1, 1990
-14.592
-6.581
82.15%
jan 1, 1991
2.254
+16.845
-115.45%
jan 1, 1992
-3.253
-5.506
-244.33%
jan 1, 1993
46.335
+49.587
-1.52K%
jan 1, 1994
11.751
-34.583
-74.64%
jan 1, 1995
-2.584
-14.335
-121.99%
jan 1, 1996
3.437
+6.021
-233.0%
jan 1, 1997
-3.3
-6.737
-196.03%
jan 1, 1998
-4.958
-1.658
50.23%
jan 1, 1999
4.21
+9.168
-184.91%
jan 1, 2000
2.887
-1.323
-31.42%
jan 1, 2001
-0.032
-2.919
-101.11%
jan 1, 2002
7.6
+7.632
-23.92K%
jan 1, 2003
4.664
-2.936
-38.64%
jan 1, 2004
3.216
-1.447
-31.04%
jan 1, 2005
1.227
-1.989
-61.85%
jan 1, 2006
2.501
+1.274
103.85%
jan 1, 2007
2.94
+0.439
17.55%
jan 1, 2008
-4.351
-7.291
-248.0%
jan 1, 2009
4.375
+8.726
-200.54%
jan 1, 2010
2.073
-2.302
-52.62%
jan 1, 2011
12.712
+10.64
513.28%
jan 1, 2012
3.096
-9.617
-75.65%
jan 1, 2013
3.107
+0.011
0.36%
jan 1, 2014
3.118
+0.011
0.36%
jan 1, 2015
-0.643
-3.761
-120.61%
Ranking of countries by current statistics by years


Comments: