29
/
en
AIzaSyAYiBZKx7MnpbEhh9jyipgxe19OcubqV5w
April 1, 2024
205410
Namibia
NAM
true
2
1
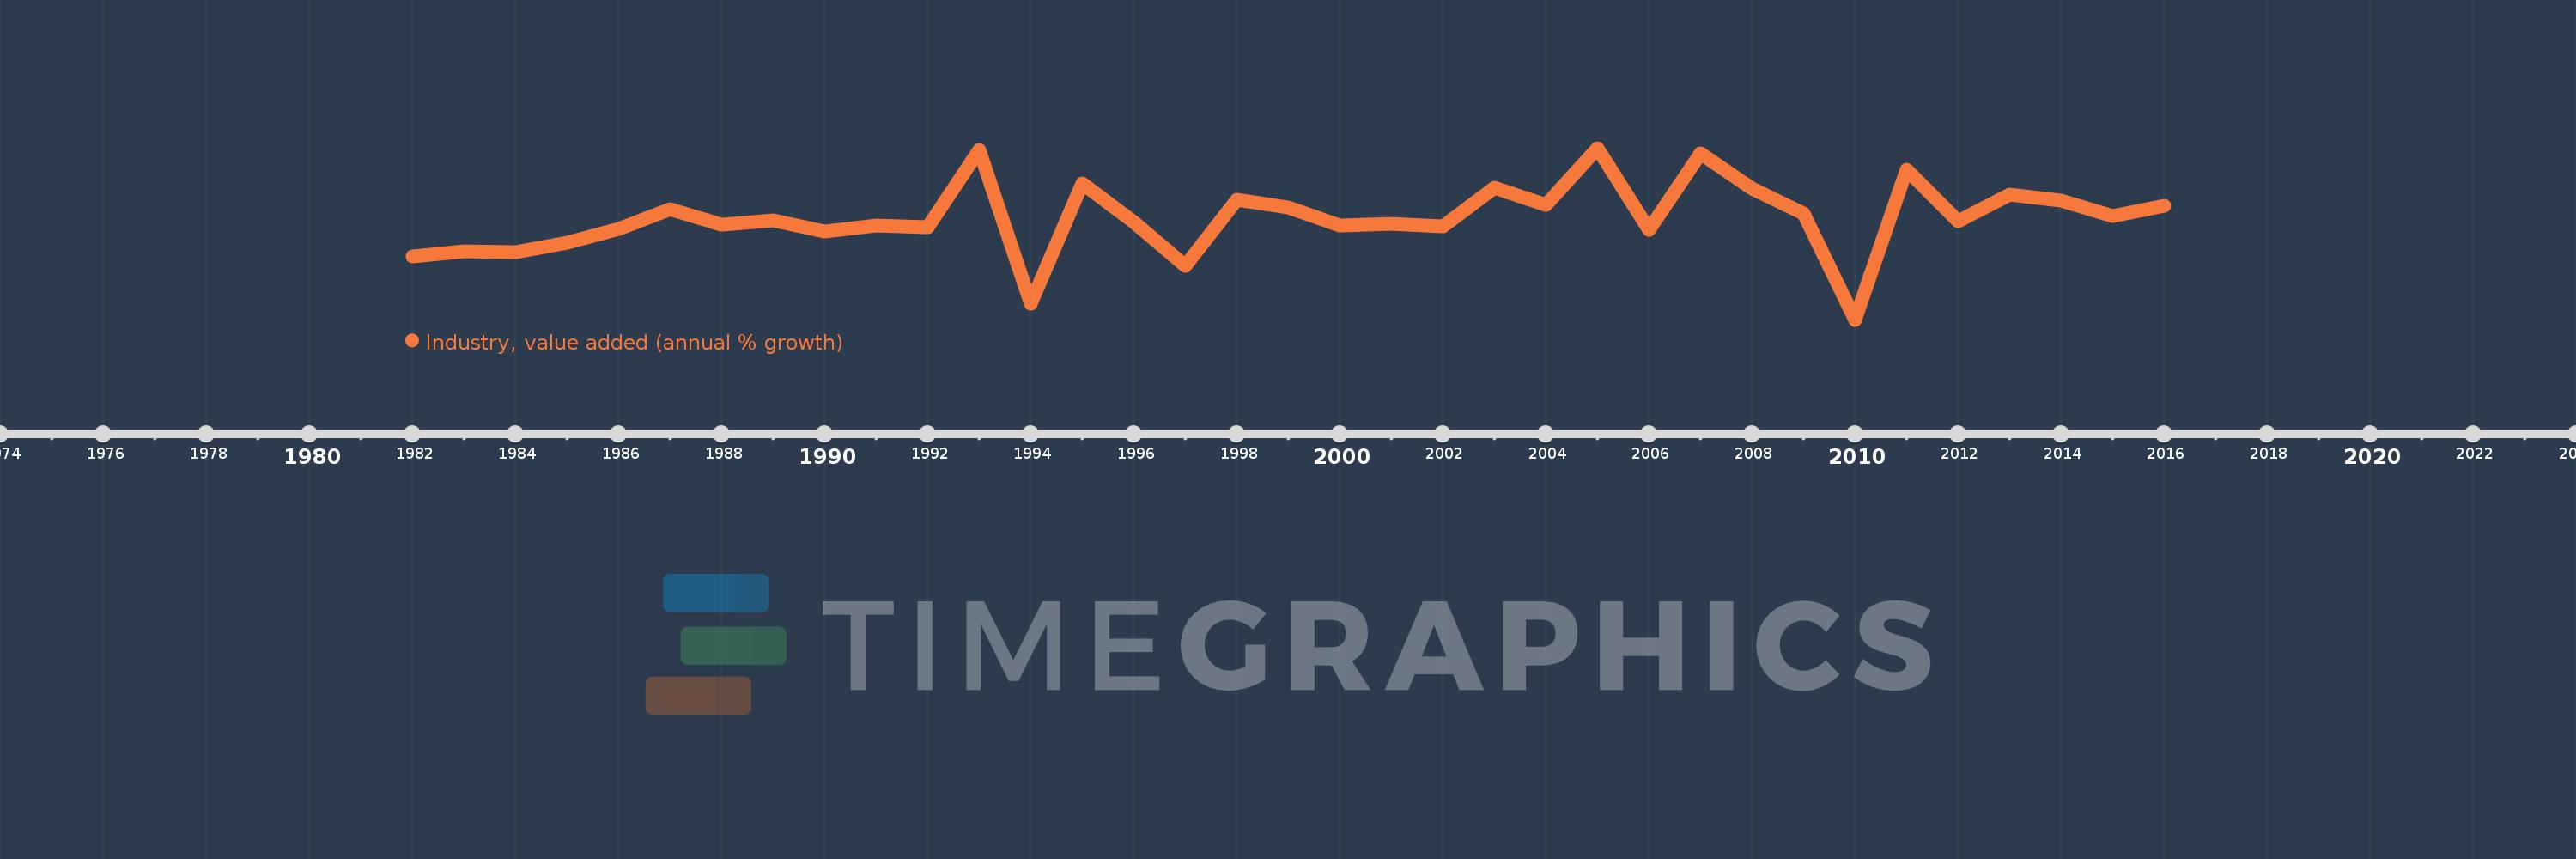
Industry, value added (annual % growth)
2016,2015,2014,2013,2012,2011,2010,2009,2008,2007,2006,2005,2004,2003,2002,2001,2000,1999,1998,1997,1996,1995,1994,1993,1992,1991,1990,1989,1988,1987,1986,1985,1984,1983,1982
This statistics in other country:
AfghanistanAlbaniaAlgeriaAntigua and BarbudaArab WorldArgentinaArmeniaAustraliaAustriaAzerbaijanBahamas, TheBahrainBangladeshBelarusBelgiumBelizeBeninBermudaBhutanBoliviaBosnia and HerzegovinaBotswanaBrazilBrunei DarussalamBulgariaBurkina FasoBurundiCabo VerdeCambodiaCameroonCanadaCaribbean small statesCayman IslandsCentral African RepublicCentral Europe and the BalticsChadChileChinaColombiaComorosCongo, Dem. Rep.Congo, Rep.Costa RicaCote d'IvoireCroatiaCubaCyprusCzech RepublicDenmarkDjiboutiDominicaDominican RepublicEarly-demographic dividendEast Asia & PacificEast Asia & Pacific (excluding high income)East Asia & Pacific (IDA & IBRD countries)EcuadorEgypt, Arab Rep.El SalvadorEquatorial GuineaEritreaEstoniaEthiopiaEuro areaEurope & Central AsiaEurope & Central Asia (excluding high income)Europe & Central Asia (IDA & IBRD countries)European UnionFijiFinlandFragile and conflict affected situationsFranceGabonGambia, TheGeorgiaGermanyGhanaGreeceGrenadaGuatemalaGuineaGuinea-BissauGuyanaHaitiHeavily indebted poor countries (HIPC)High incomeHondurasHong Kong SAR, ChinaHungaryIBRD onlyIcelandIDA & IBRD totalIDA blendIDA onlyIDA totalIndiaIndonesiaIran, Islamic Rep.IraqIrelandItalyJamaicaJapanJordanKazakhstanKenyaKiribatiKorea, Rep.KosovoKuwaitKyrgyz RepublicLao PDRLate-demographic dividendLatin America & Caribbean Latin America & Caribbean (excluding high income)Latin America & the Caribbean (IDA & IBRD countries)LatviaLeast developed countries: UN classificationLebanonLesothoLiberiaLithuaniaLow & middle incomeLow incomeLower middle incomeLuxembourgMacedonia, FYRMadagascarMalawiMalaysiaMaldivesMaliMarshall IslandsMauritaniaMauritiusMexicoMicronesia, Fed. Sts.Middle East & North AfricaMiddle East & North Africa (excluding high income)Middle East & North Africa (IDA & IBRD countries)Middle incomeMoldovaMongoliaMontenegroMoroccoMozambiqueMyanmarNamibiaNepalNetherlandsNew ZealandNicaraguaNigerNigeriaNorth AmericaNorwayOECD membersOmanOther small statesPacific island small statesPakistanPalauPanamaPapua New GuineaParaguayPeruPhilippinesPolandPortugalPost-demographic dividendPre-demographic dividendPuerto RicoQatarRomaniaRussian FederationRwandaSamoaSao Tome and PrincipeSaudi ArabiaSenegalSerbiaSeychellesSierra LeoneSingaporeSlovak RepublicSloveniaSmall statesSolomon IslandsSomaliaSouth AfricaSouth AsiaSouth Asia (IDA & IBRD)SpainSri LankaSt. Kitts and NevisSt. LuciaSt. Vincent and the GrenadinesSub-Saharan Africa Sub-Saharan Africa (excluding high income)Sub-Saharan Africa (IDA & IBRD countries)SudanSurinameSwazilandSwedenSwitzerlandSyrian Arab RepublicTajikistanTanzaniaThailandTimor-LesteTogoTongaTrinidad and TobagoTunisiaTurkeyTurkmenistanTuvaluUgandaUkraineUnited Arab EmiratesUnited KingdomUnited StatesUpper middle incomeUruguayUzbekistanVanuatuVenezuela, RBVietnamWest Bank and GazaWorldZambiaZimbabwe Timeline:
This timeline shows a graph from 1982 to 2016 of Namibia. No data until 1981. Number of actual observations by date: 35.
Source name:
World Development Indicators
Source organization:
World Bank national accounts data, and OECD National Accounts data files.
Categories, topics:
Economy & Growth
Last updated:
apr 23, 2017
Indicators value changes by year
Minimum:
-15.884
jan 1, 2010
Maximum:
16.082
jan 1, 2005
At the date of observation
Value
Absolute change
Change from previous value
jan 1, 1982
-4.042
-4.042
0.0%
jan 1, 1983
-3.152
+0.89
-22.03%
jan 1, 1984
-3.323
-0.172
5.44%
jan 1, 1985
-1.559
+1.764
-53.08%
jan 1, 1986
1.074
+2.633
-168.85%
jan 1, 1987
4.7
+3.626
337.75%
jan 1, 1988
1.863
-2.836
-60.35%
jan 1, 1989
2.674
+0.81
43.49%
jan 1, 1990
0.565
-2.109
-78.89%
jan 1, 1991
1.647
+1.083
191.81%
jan 1, 1992
1.295
-0.352
-21.36%
jan 1, 1993
15.707
+14.412
1.11K%
jan 1, 1994
-12.83
-28.537
-181.68%
jan 1, 1995
9.441
+22.271
-173.58%
jan 1, 1996
2.304
-7.136
-75.59%
jan 1, 1997
-5.881
-8.186
-355.22%
jan 1, 1998
6.437
+12.318
-209.44%
jan 1, 1999
5.026
-1.411
-21.92%
jan 1, 2000
1.585
-3.44
-68.46%
jan 1, 2001
1.927
+0.342
21.59%
jan 1, 2002
1.538
-0.39
-20.21%
jan 1, 2003
8.732
+7.194
467.87%
jan 1, 2004
5.469
-3.263
-37.37%
jan 1, 2005
16.082
+10.613
194.07%
jan 1, 2006
0.858
-15.223
-94.66%
jan 1, 2007
15.01
+14.152
1.65K%
jan 1, 2008
8.485
-6.526
-43.47%
jan 1, 2009
3.905
-4.58
-53.98%
jan 1, 2010
-15.884
-19.789
-506.79%
jan 1, 2011
12.079
+27.963
-176.05%
jan 1, 2012
2.441
-9.638
-79.79%
jan 1, 2013
7.455
+5.015
205.46%
jan 1, 2014
6.231
-1.225
-16.43%
jan 1, 2015
3.403
-2.828
-45.39%
jan 1, 2016
5.257
+1.855
54.51%
Ranking of countries by current statistics by years


Comments: