29
/
en
AIzaSyAYiBZKx7MnpbEhh9jyipgxe19OcubqV5w
April 1, 2024
226845
Puerto Rico
PRI
true
2
1
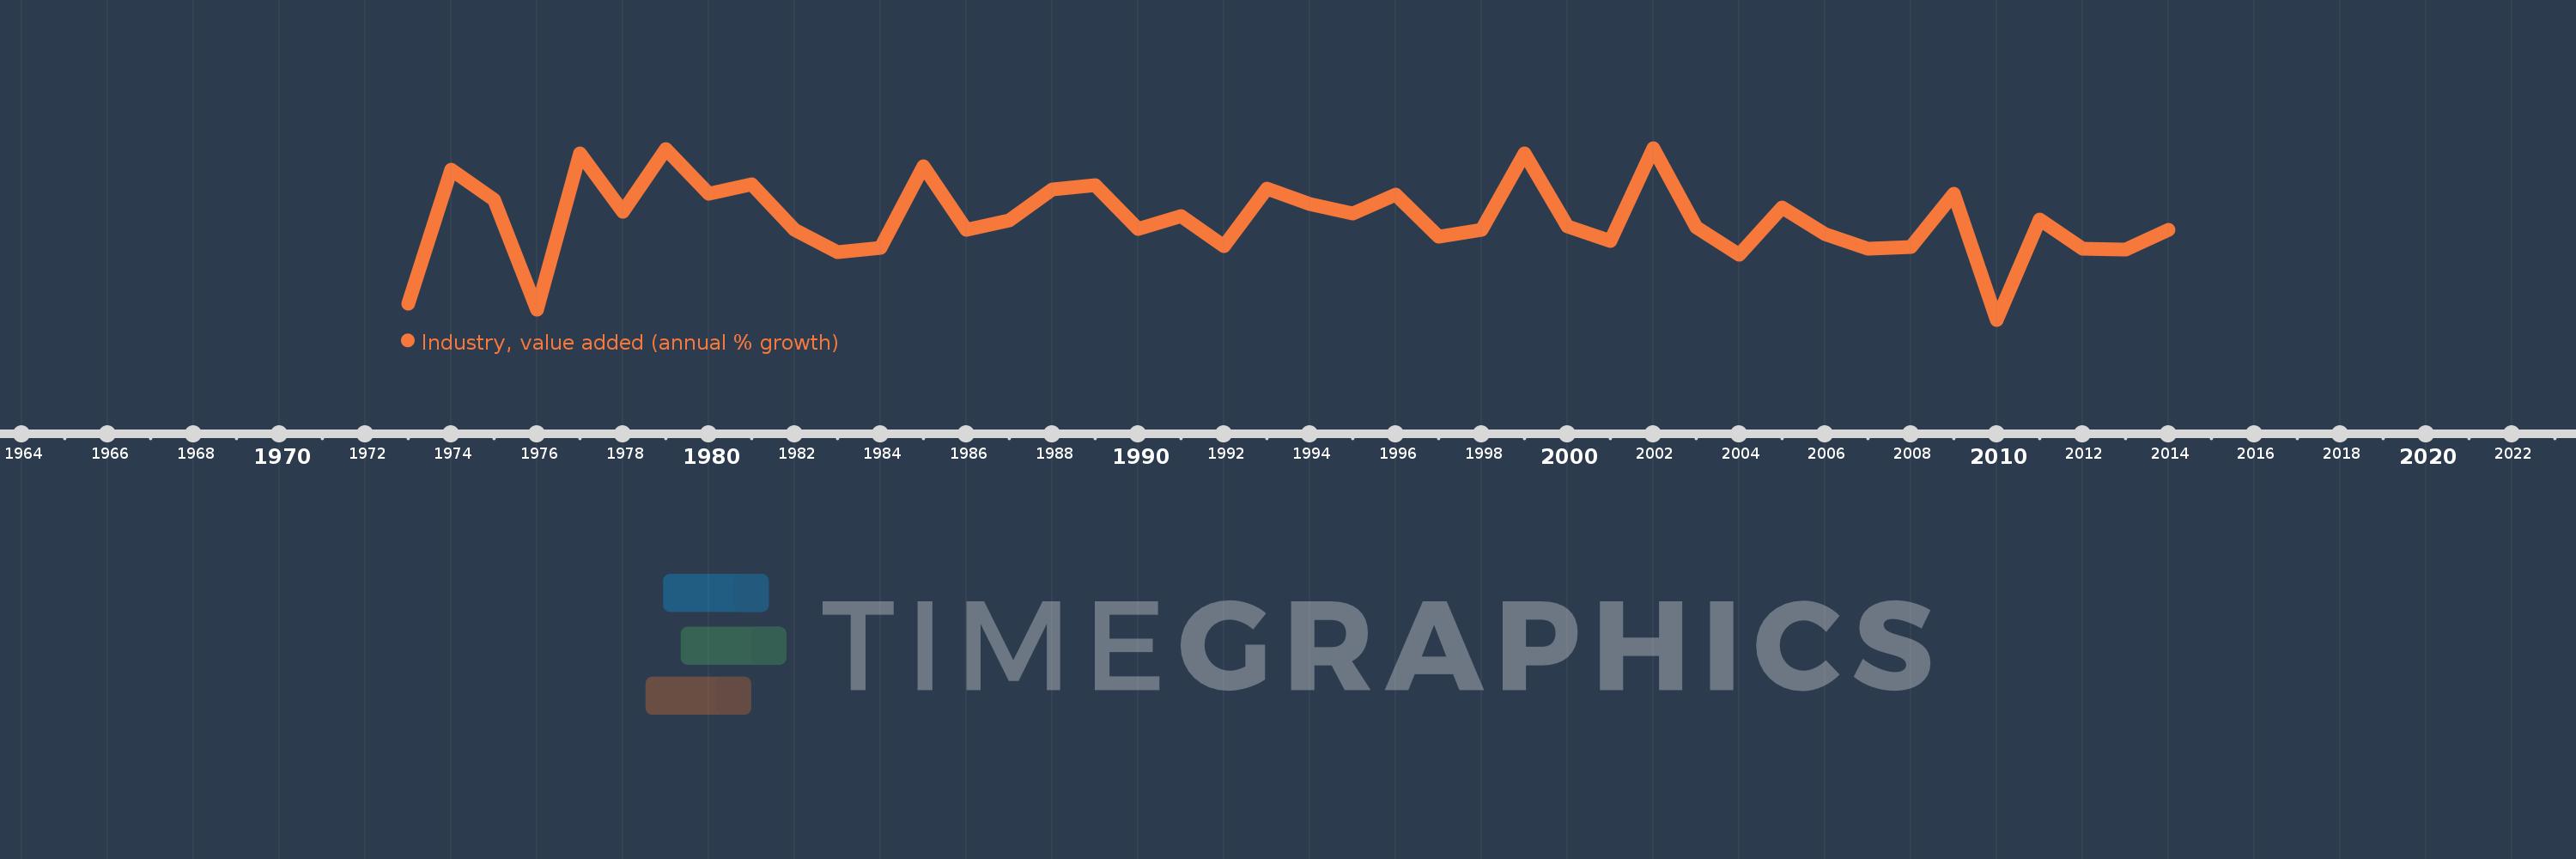
Industry, value added (annual % growth)
2014,2013,2012,2011,2010,2009,2008,2007,2006,2005,2004,2003,2002,2001,2000,1999,1998,1997,1996,1995,1994,1993,1992,1991,1990,1989,1988,1987,1986,1985,1984,1983,1982,1981,1980,1979,1978,1977,1976,1975,1974,1973
This statistics in other country:
AfghanistanAlbaniaAlgeriaAntigua and BarbudaArab WorldArgentinaArmeniaAustraliaAustriaAzerbaijanBahamas, TheBahrainBangladeshBelarusBelgiumBelizeBeninBermudaBhutanBoliviaBosnia and HerzegovinaBotswanaBrazilBrunei DarussalamBulgariaBurkina FasoBurundiCabo VerdeCambodiaCameroonCanadaCaribbean small statesCayman IslandsCentral African RepublicCentral Europe and the BalticsChadChileChinaColombiaComorosCongo, Dem. Rep.Congo, Rep.Costa RicaCote d'IvoireCroatiaCubaCyprusCzech RepublicDenmarkDjiboutiDominicaDominican RepublicEarly-demographic dividendEast Asia & PacificEast Asia & Pacific (excluding high income)East Asia & Pacific (IDA & IBRD countries)EcuadorEgypt, Arab Rep.El SalvadorEquatorial GuineaEritreaEstoniaEthiopiaEuro areaEurope & Central AsiaEurope & Central Asia (excluding high income)Europe & Central Asia (IDA & IBRD countries)European UnionFijiFinlandFragile and conflict affected situationsFranceGabonGambia, TheGeorgiaGermanyGhanaGreeceGrenadaGuatemalaGuineaGuinea-BissauGuyanaHaitiHeavily indebted poor countries (HIPC)High incomeHondurasHong Kong SAR, ChinaHungaryIBRD onlyIcelandIDA & IBRD totalIDA blendIDA onlyIDA totalIndiaIndonesiaIran, Islamic Rep.IraqIrelandItalyJamaicaJapanJordanKazakhstanKenyaKiribatiKorea, Rep.KosovoKuwaitKyrgyz RepublicLao PDRLate-demographic dividendLatin America & Caribbean Latin America & Caribbean (excluding high income)Latin America & the Caribbean (IDA & IBRD countries)LatviaLeast developed countries: UN classificationLebanonLesothoLiberiaLithuaniaLow & middle incomeLow incomeLower middle incomeLuxembourgMacedonia, FYRMadagascarMalawiMalaysiaMaldivesMaliMarshall IslandsMauritaniaMauritiusMexicoMicronesia, Fed. Sts.Middle East & North AfricaMiddle East & North Africa (excluding high income)Middle East & North Africa (IDA & IBRD countries)Middle incomeMoldovaMongoliaMontenegroMoroccoMozambiqueMyanmarNamibiaNepalNetherlandsNew ZealandNicaraguaNigerNigeriaNorth AmericaNorwayOECD membersOmanOther small statesPacific island small statesPakistanPalauPanamaPapua New GuineaParaguayPeruPhilippinesPolandPortugalPost-demographic dividendPre-demographic dividendPuerto RicoQatarRomaniaRussian FederationRwandaSamoaSao Tome and PrincipeSaudi ArabiaSenegalSerbiaSeychellesSierra LeoneSingaporeSlovak RepublicSloveniaSmall statesSolomon IslandsSomaliaSouth AfricaSouth AsiaSouth Asia (IDA & IBRD)SpainSri LankaSt. Kitts and NevisSt. LuciaSt. Vincent and the GrenadinesSub-Saharan Africa Sub-Saharan Africa (excluding high income)Sub-Saharan Africa (IDA & IBRD countries)SudanSurinameSwazilandSwedenSwitzerlandSyrian Arab RepublicTajikistanTanzaniaThailandTimor-LesteTogoTongaTrinidad and TobagoTunisiaTurkeyTurkmenistanTuvaluUgandaUkraineUnited Arab EmiratesUnited KingdomUnited StatesUpper middle incomeUruguayUzbekistanVanuatuVenezuela, RBVietnamWest Bank and GazaWorldZambiaZimbabwe Timeline:
This timeline shows a graph from 1973 to 2014 of Puerto Rico. No data until 1972. Number of actual observations by date: 42.
Source name:
World Development Indicators
Source organization:
World Bank national accounts data, and OECD National Accounts data files.
Categories, topics:
Economy & Growth
Last updated:
apr 23, 2017
Indicators value changes by year
Minimum:
-12.189
jan 1, 2010
Maximum:
13.427
jan 1, 2002
At the date of observation
Value
Absolute change
Change from previous value
jan 1, 1973
-9.806
-9.806
0.0%
jan 1, 1974
10.166
+19.972
-203.66%
jan 1, 1975
5.711
-4.455
-43.82%
jan 1, 1976
-10.682
-16.393
-287.04%
jan 1, 1977
12.587
+23.269
-217.84%
jan 1, 1978
3.962
-8.625
-68.52%
jan 1, 1979
13.269
+9.307
234.92%
jan 1, 1980
6.579
-6.69
-50.42%
jan 1, 1981
7.986
+1.407
21.39%
jan 1, 1982
1.201
-6.786
-84.97%
jan 1, 1983
-2.085
-3.285
-273.64%
jan 1, 1984
-1.407
+0.678
-32.53%
jan 1, 1985
10.714
+12.12
-861.72%
jan 1, 1986
1.26
-9.454
-88.24%
jan 1, 1987
2.595
+1.335
105.9%
jan 1, 1988
7.224
+4.629
178.42%
jan 1, 1989
7.916
+0.692
9.58%
jan 1, 1990
1.365
-6.551
-82.75%
jan 1, 1991
3.33
+1.965
143.93%
jan 1, 1992
-1.186
-4.517
-135.62%
jan 1, 1993
7.326
+8.512
-717.66%
jan 1, 1994
5.096
-2.23
-30.44%
jan 1, 1995
3.661
-1.435
-28.16%
jan 1, 1996
6.439
+2.778
75.89%
jan 1, 1997
0.234
-6.205
-96.36%
jan 1, 1998
1.251
+1.017
434.22%
jan 1, 1999
12.659
+11.408
911.87%
jan 1, 2000
1.678
-10.98
-86.74%
jan 1, 2001
-0.4
-2.078
-123.81%
jan 1, 2002
13.427
+13.827
-3.46K%
jan 1, 2003
1.662
-11.765
-87.62%
jan 1, 2004
-2.45
-4.112
-247.43%
jan 1, 2005
4.6
+7.05
-287.73%
jan 1, 2006
0.628
-3.972
-86.34%
jan 1, 2007
-1.574
-2.202
-350.45%
jan 1, 2008
-1.285
+0.289
-18.34%
jan 1, 2009
6.551
+7.836
-609.82%
jan 1, 2010
-12.189
-18.74
-286.07%
jan 1, 2011
2.81
+14.999
-123.05%
jan 1, 2012
-1.66
-4.47
-159.07%
jan 1, 2013
-1.786
-0.126
7.57%
jan 1, 2014
1.241
+3.027
-169.51%
Ranking of countries by current statistics by years


Comments: