29
/
en
AIzaSyAYiBZKx7MnpbEhh9jyipgxe19OcubqV5w
April 1, 2024
281125
Venezuela, RB
VEN
true
2
1
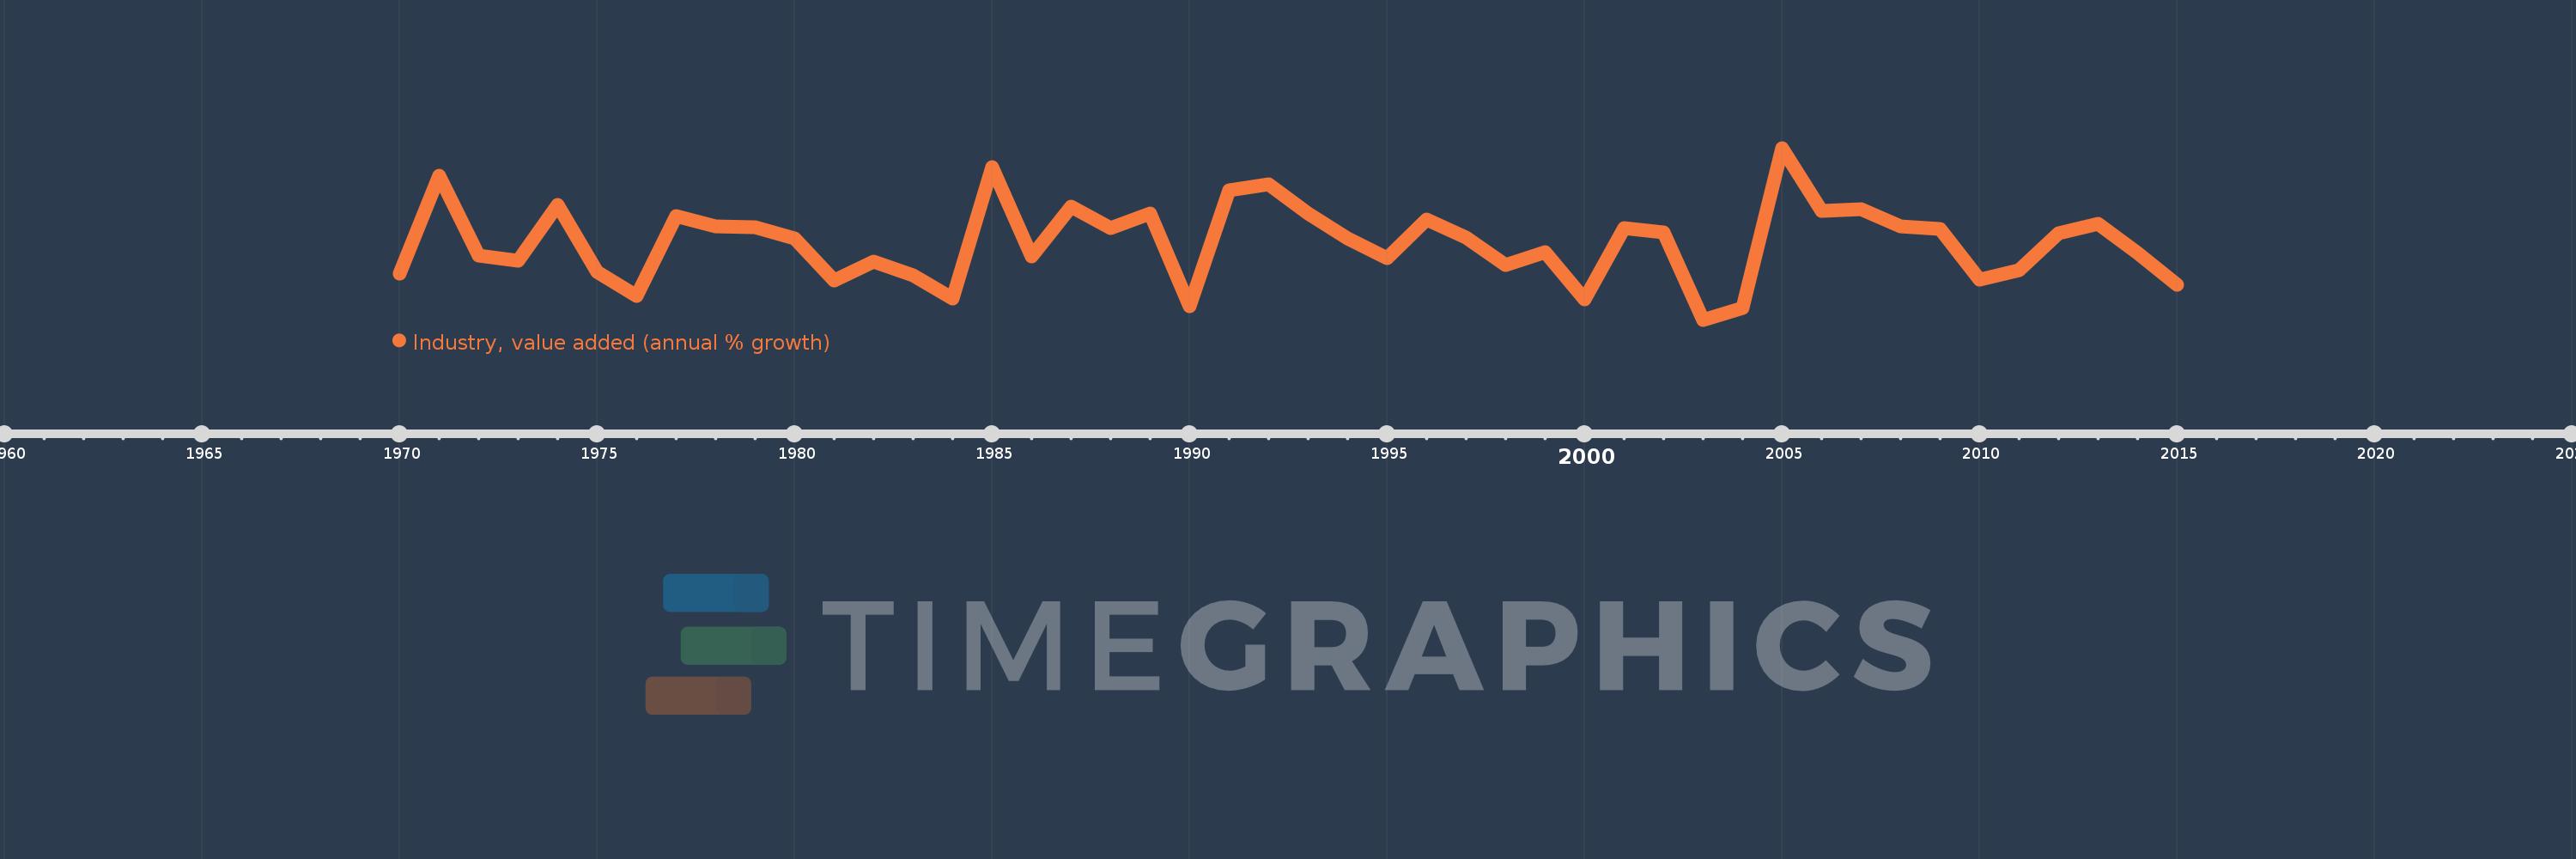
Industry, value added (annual % growth)
2015,2014,2013,2012,2011,2010,2009,2008,2007,2006,2005,2004,2003,2002,2001,2000,1999,1998,1997,1996,1995,1994,1993,1992,1991,1990,1989,1988,1987,1986,1985,1984,1983,1982,1981,1980,1979,1978,1977,1976,1975,1974,1973,1972,1971,1970
This statistics in other country:
AfghanistanAlbaniaAlgeriaAntigua and BarbudaArab WorldArgentinaArmeniaAustraliaAustriaAzerbaijanBahamas, TheBahrainBangladeshBelarusBelgiumBelizeBeninBermudaBhutanBoliviaBosnia and HerzegovinaBotswanaBrazilBrunei DarussalamBulgariaBurkina FasoBurundiCabo VerdeCambodiaCameroonCanadaCaribbean small statesCayman IslandsCentral African RepublicCentral Europe and the BalticsChadChileChinaColombiaComorosCongo, Dem. Rep.Congo, Rep.Costa RicaCote d'IvoireCroatiaCubaCyprusCzech RepublicDenmarkDjiboutiDominicaDominican RepublicEarly-demographic dividendEast Asia & PacificEast Asia & Pacific (excluding high income)East Asia & Pacific (IDA & IBRD countries)EcuadorEgypt, Arab Rep.El SalvadorEquatorial GuineaEritreaEstoniaEthiopiaEuro areaEurope & Central AsiaEurope & Central Asia (excluding high income)Europe & Central Asia (IDA & IBRD countries)European UnionFijiFinlandFragile and conflict affected situationsFranceGabonGambia, TheGeorgiaGermanyGhanaGreeceGrenadaGuatemalaGuineaGuinea-BissauGuyanaHaitiHeavily indebted poor countries (HIPC)High incomeHondurasHong Kong SAR, ChinaHungaryIBRD onlyIcelandIDA & IBRD totalIDA blendIDA onlyIDA totalIndiaIndonesiaIran, Islamic Rep.IraqIrelandItalyJamaicaJapanJordanKazakhstanKenyaKiribatiKorea, Rep.KosovoKuwaitKyrgyz RepublicLao PDRLate-demographic dividendLatin America & Caribbean Latin America & Caribbean (excluding high income)Latin America & the Caribbean (IDA & IBRD countries)LatviaLeast developed countries: UN classificationLebanonLesothoLiberiaLithuaniaLow & middle incomeLow incomeLower middle incomeLuxembourgMacedonia, FYRMadagascarMalawiMalaysiaMaldivesMaliMarshall IslandsMauritaniaMauritiusMexicoMicronesia, Fed. Sts.Middle East & North AfricaMiddle East & North Africa (excluding high income)Middle East & North Africa (IDA & IBRD countries)Middle incomeMoldovaMongoliaMontenegroMoroccoMozambiqueMyanmarNamibiaNepalNetherlandsNew ZealandNicaraguaNigerNigeriaNorth AmericaNorwayOECD membersOmanOther small statesPacific island small statesPakistanPalauPanamaPapua New GuineaParaguayPeruPhilippinesPolandPortugalPost-demographic dividendPre-demographic dividendPuerto RicoQatarRomaniaRussian FederationRwandaSamoaSao Tome and PrincipeSaudi ArabiaSenegalSerbiaSeychellesSierra LeoneSingaporeSlovak RepublicSloveniaSmall statesSolomon IslandsSomaliaSouth AfricaSouth AsiaSouth Asia (IDA & IBRD)SpainSri LankaSt. Kitts and NevisSt. LuciaSt. Vincent and the GrenadinesSub-Saharan Africa Sub-Saharan Africa (excluding high income)Sub-Saharan Africa (IDA & IBRD countries)SudanSurinameSwazilandSwedenSwitzerlandSyrian Arab RepublicTajikistanTanzaniaThailandTimor-LesteTogoTongaTrinidad and TobagoTunisiaTurkeyTurkmenistanTuvaluUgandaUkraineUnited Arab EmiratesUnited KingdomUnited StatesUpper middle incomeUruguayUzbekistanVanuatuVenezuela, RBVietnamWest Bank and GazaWorldZambiaZimbabwe Timeline:
This timeline shows a graph from 1970 to 2015 of Venezuela, RB. No data until 1969. Number of actual observations by date: 46.
Source name:
World Development Indicators
Source organization:
World Bank national accounts data, and OECD National Accounts data files.
Categories, topics:
Economy & Growth
Last updated:
apr 23, 2017
Indicators value changes by year
Minimum:
-11.82
jan 1, 2003
Maximum:
17.606
jan 1, 2005
At the date of observation
Value
Absolute change
Change from previous value
jan 1, 1970
-3.911
-3.911
0.0%
jan 1, 1971
12.872
+16.783
-429.15%
jan 1, 1972
-0.799
-13.671
-106.21%
jan 1, 1973
-1.68
-0.881
110.3%
jan 1, 1974
7.785
+9.464
-563.38%
jan 1, 1975
-3.68
-11.464
-147.27%
jan 1, 1976
-7.691
-4.011
109.01%
jan 1, 1977
5.873
+13.564
-176.36%
jan 1, 1978
4.142
-1.731
-29.48%
jan 1, 1979
4.022
-0.12
-2.89%
jan 1, 1980
2.061
-1.961
-48.75%
jan 1, 1981
-5.09
-7.151
-346.9%
jan 1, 1982
-1.906
+3.184
-62.56%
jan 1, 1983
-4.205
-2.3
120.67%
jan 1, 1984
-8.219
-4.013
95.44%
jan 1, 1985
14.308
+22.527
-274.09%
jan 1, 1986
-1.026
-15.334
-107.17%
jan 1, 1987
7.565
+8.59
-837.39%
jan 1, 1988
3.819
-3.745
-49.51%
jan 1, 1989
6.414
+2.595
67.94%
jan 1, 1990
-9.563
-15.977
-249.1%
jan 1, 1991
10.33
+19.894
-208.02%
jan 1, 1992
11.433
+1.103
10.68%
jan 1, 1993
6.329
-5.105
-44.65%
jan 1, 1994
2.076
-4.253
-67.2%
jan 1, 1995
-1.327
-3.403
-163.94%
jan 1, 1996
5.394
+6.721
-506.46%
jan 1, 1997
2.295
-3.099
-57.46%
jan 1, 1998
-2.403
-4.698
-204.72%
jan 1, 1999
-0.309
+2.094
-87.15%
jan 1, 2000
-8.351
-8.042
2.6K%
jan 1, 2001
3.833
+12.185
-145.9%
jan 1, 2002
3.2
-0.633
-16.51%
jan 1, 2003
-11.82
-15.02
-469.33%
jan 1, 2004
-9.792
+2.028
-17.15%
jan 1, 2005
17.606
+27.399
-279.8%
jan 1, 2006
6.794
-10.812
-61.41%
jan 1, 2007
7.074
+0.279
4.11%
jan 1, 2008
4.135
-2.939
-41.54%
jan 1, 2009
3.679
-0.455
-11.01%
jan 1, 2010
-4.96
-8.639
-234.79%
jan 1, 2011
-3.359
+1.601
-32.28%
jan 1, 2012
3.052
+6.411
-190.87%
jan 1, 2013
4.665
+1.613
52.85%
jan 1, 2014
-0.416
-5.081
-108.92%
jan 1, 2015
-5.843
-5.426
1.3K%
Ranking of countries by current statistics by years


Comments: