29
/
en
AIzaSyAYiBZKx7MnpbEhh9jyipgxe19OcubqV5w
April 1, 2024
95015
Burkina Faso
BFA
true
2
1
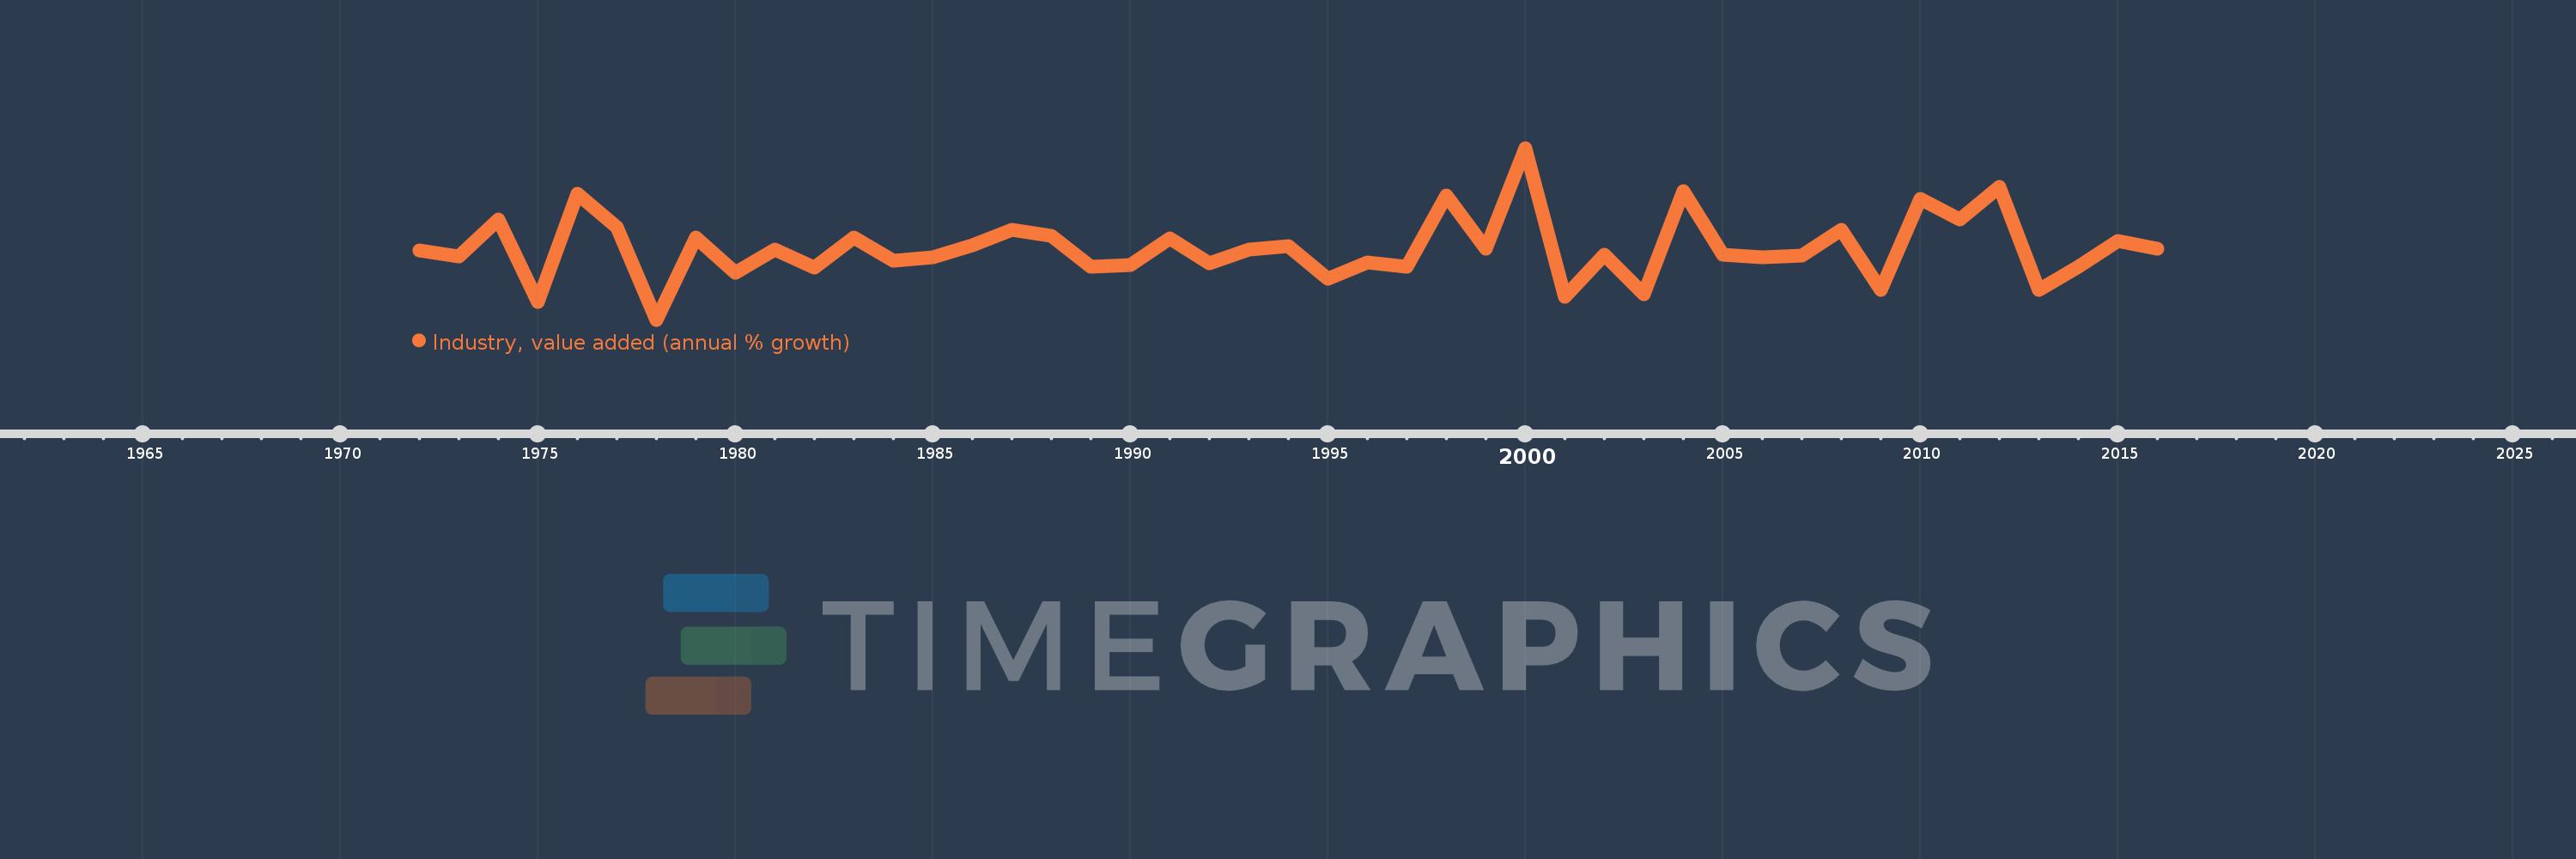
Industry, value added (annual % growth)
2016,2015,2014,2013,2012,2011,2010,2009,2008,2007,2006,2005,2004,2003,2002,2001,2000,1999,1998,1997,1996,1995,1994,1993,1992,1991,1990,1989,1988,1987,1986,1985,1984,1983,1982,1981,1980,1979,1978,1977,1976,1975,1974,1973,1972
This statistics in other country:
AfghanistanAlbaniaAlgeriaAntigua and BarbudaArab WorldArgentinaArmeniaAustraliaAustriaAzerbaijanBahamas, TheBahrainBangladeshBelarusBelgiumBelizeBeninBermudaBhutanBoliviaBosnia and HerzegovinaBotswanaBrazilBrunei DarussalamBulgariaBurkina FasoBurundiCabo VerdeCambodiaCameroonCanadaCaribbean small statesCayman IslandsCentral African RepublicCentral Europe and the BalticsChadChileChinaColombiaComorosCongo, Dem. Rep.Congo, Rep.Costa RicaCote d'IvoireCroatiaCubaCyprusCzech RepublicDenmarkDjiboutiDominicaDominican RepublicEarly-demographic dividendEast Asia & PacificEast Asia & Pacific (excluding high income)East Asia & Pacific (IDA & IBRD countries)EcuadorEgypt, Arab Rep.El SalvadorEquatorial GuineaEritreaEstoniaEthiopiaEuro areaEurope & Central AsiaEurope & Central Asia (excluding high income)Europe & Central Asia (IDA & IBRD countries)European UnionFijiFinlandFragile and conflict affected situationsFranceGabonGambia, TheGeorgiaGermanyGhanaGreeceGrenadaGuatemalaGuineaGuinea-BissauGuyanaHaitiHeavily indebted poor countries (HIPC)High incomeHondurasHong Kong SAR, ChinaHungaryIBRD onlyIcelandIDA & IBRD totalIDA blendIDA onlyIDA totalIndiaIndonesiaIran, Islamic Rep.IraqIrelandItalyJamaicaJapanJordanKazakhstanKenyaKiribatiKorea, Rep.KosovoKuwaitKyrgyz RepublicLao PDRLate-demographic dividendLatin America & Caribbean Latin America & Caribbean (excluding high income)Latin America & the Caribbean (IDA & IBRD countries)LatviaLeast developed countries: UN classificationLebanonLesothoLiberiaLithuaniaLow & middle incomeLow incomeLower middle incomeLuxembourgMacedonia, FYRMadagascarMalawiMalaysiaMaldivesMaliMarshall IslandsMauritaniaMauritiusMexicoMicronesia, Fed. Sts.Middle East & North AfricaMiddle East & North Africa (excluding high income)Middle East & North Africa (IDA & IBRD countries)Middle incomeMoldovaMongoliaMontenegroMoroccoMozambiqueMyanmarNamibiaNepalNetherlandsNew ZealandNicaraguaNigerNigeriaNorth AmericaNorwayOECD membersOmanOther small statesPacific island small statesPakistanPalauPanamaPapua New GuineaParaguayPeruPhilippinesPolandPortugalPost-demographic dividendPre-demographic dividendPuerto RicoQatarRomaniaRussian FederationRwandaSamoaSao Tome and PrincipeSaudi ArabiaSenegalSerbiaSeychellesSierra LeoneSingaporeSlovak RepublicSloveniaSmall statesSolomon IslandsSomaliaSouth AfricaSouth AsiaSouth Asia (IDA & IBRD)SpainSri LankaSt. Kitts and NevisSt. LuciaSt. Vincent and the GrenadinesSub-Saharan Africa Sub-Saharan Africa (excluding high income)Sub-Saharan Africa (IDA & IBRD countries)SudanSurinameSwazilandSwedenSwitzerlandSyrian Arab RepublicTajikistanTanzaniaThailandTimor-LesteTogoTongaTrinidad and TobagoTunisiaTurkeyTurkmenistanTuvaluUgandaUkraineUnited Arab EmiratesUnited KingdomUnited StatesUpper middle incomeUruguayUzbekistanVanuatuVenezuela, RBVietnamWest Bank and GazaWorldZambiaZimbabwe Timeline:
This timeline shows a graph from 1972 to 2016 of Burkina Faso. No data until 1971. Number of actual observations by date: 45.
Source name:
World Development Indicators
Source organization:
World Bank national accounts data, and OECD National Accounts data files.
Categories, topics:
Economy & Growth
Last updated:
apr 23, 2017
Indicators value changes by year
Minimum:
-16.916
jan 1, 1978
Maximum:
34.698
jan 1, 2000
At the date of observation
Value
Absolute change
Change from previous value
jan 1, 1972
3.997
+3.997
0.0%
jan 1, 1973
2.018
-1.979
-49.51%
jan 1, 1974
13.08
+11.062
548.1%
jan 1, 1975
-11.684
-24.763
-189.33%
jan 1, 1976
20.983
+32.667
-279.59%
jan 1, 1977
10.773
-10.21
-48.66%
jan 1, 1978
-16.916
-27.69
-257.02%
jan 1, 1979
7.659
+24.575
-145.28%
jan 1, 1980
-2.92
-10.58
-138.13%
jan 1, 1981
4.149
+7.069
-242.07%
jan 1, 1982
-1.333
-5.482
-132.13%
jan 1, 1983
7.896
+9.229
-692.33%
jan 1, 1984
0.783
-7.113
-90.08%
jan 1, 1985
1.748
+0.965
123.25%
jan 1, 1986
5.539
+3.791
216.83%
jan 1, 1987
10.107
+4.568
82.47%
jan 1, 1988
8.37
-1.737
-17.19%
jan 1, 1989
-0.951
-9.321
-111.36%
jan 1, 1990
-0.543
+0.408
-42.89%
jan 1, 1991
7.629
+8.172
-1.51K%
jan 1, 1992
0.126
-7.503
-98.35%
jan 1, 1993
4.163
+4.037
3.2K%
jan 1, 1994
5.274
+1.111
26.69%
jan 1, 1995
-4.563
-9.837
-186.52%
jan 1, 1996
0.198
+4.761
-104.35%
jan 1, 1997
-0.87
-1.068
-538.6%
jan 1, 1998
20.398
+21.268
-2.44K%
jan 1, 1999
4.344
-16.054
-78.7%
jan 1, 2000
34.698
+30.353
698.7%
jan 1, 2001
-10.016
-44.713
-128.87%
jan 1, 2002
2.51
+12.526
-125.06%
jan 1, 2003
-9.359
-11.869
-472.92%
jan 1, 2004
21.671
+31.03
-331.55%
jan 1, 2005
2.602
-19.069
-87.99%
jan 1, 2006
1.861
-0.741
-28.48%
jan 1, 2007
2.353
+0.492
26.42%
jan 1, 2008
9.993
+7.64
324.74%
jan 1, 2009
-8.064
-18.057
-180.7%
jan 1, 2010
19.276
+27.34
-339.04%
jan 1, 2011
13.195
-6.082
-31.55%
jan 1, 2012
22.927
+9.733
73.76%
jan 1, 2013
-7.992
-30.919
-134.86%
jan 1, 2014
-0.958
+7.033
-88.01%
jan 1, 2015
6.854
+7.812
-815.15%
jan 1, 2016
4.461
-2.392
-34.9%
Ranking of countries by current statistics by years


Comments: