29
/
en
AIzaSyAYiBZKx7MnpbEhh9jyipgxe19OcubqV5w
April 1, 2024
254257
Suriname
SUR
true
2
1
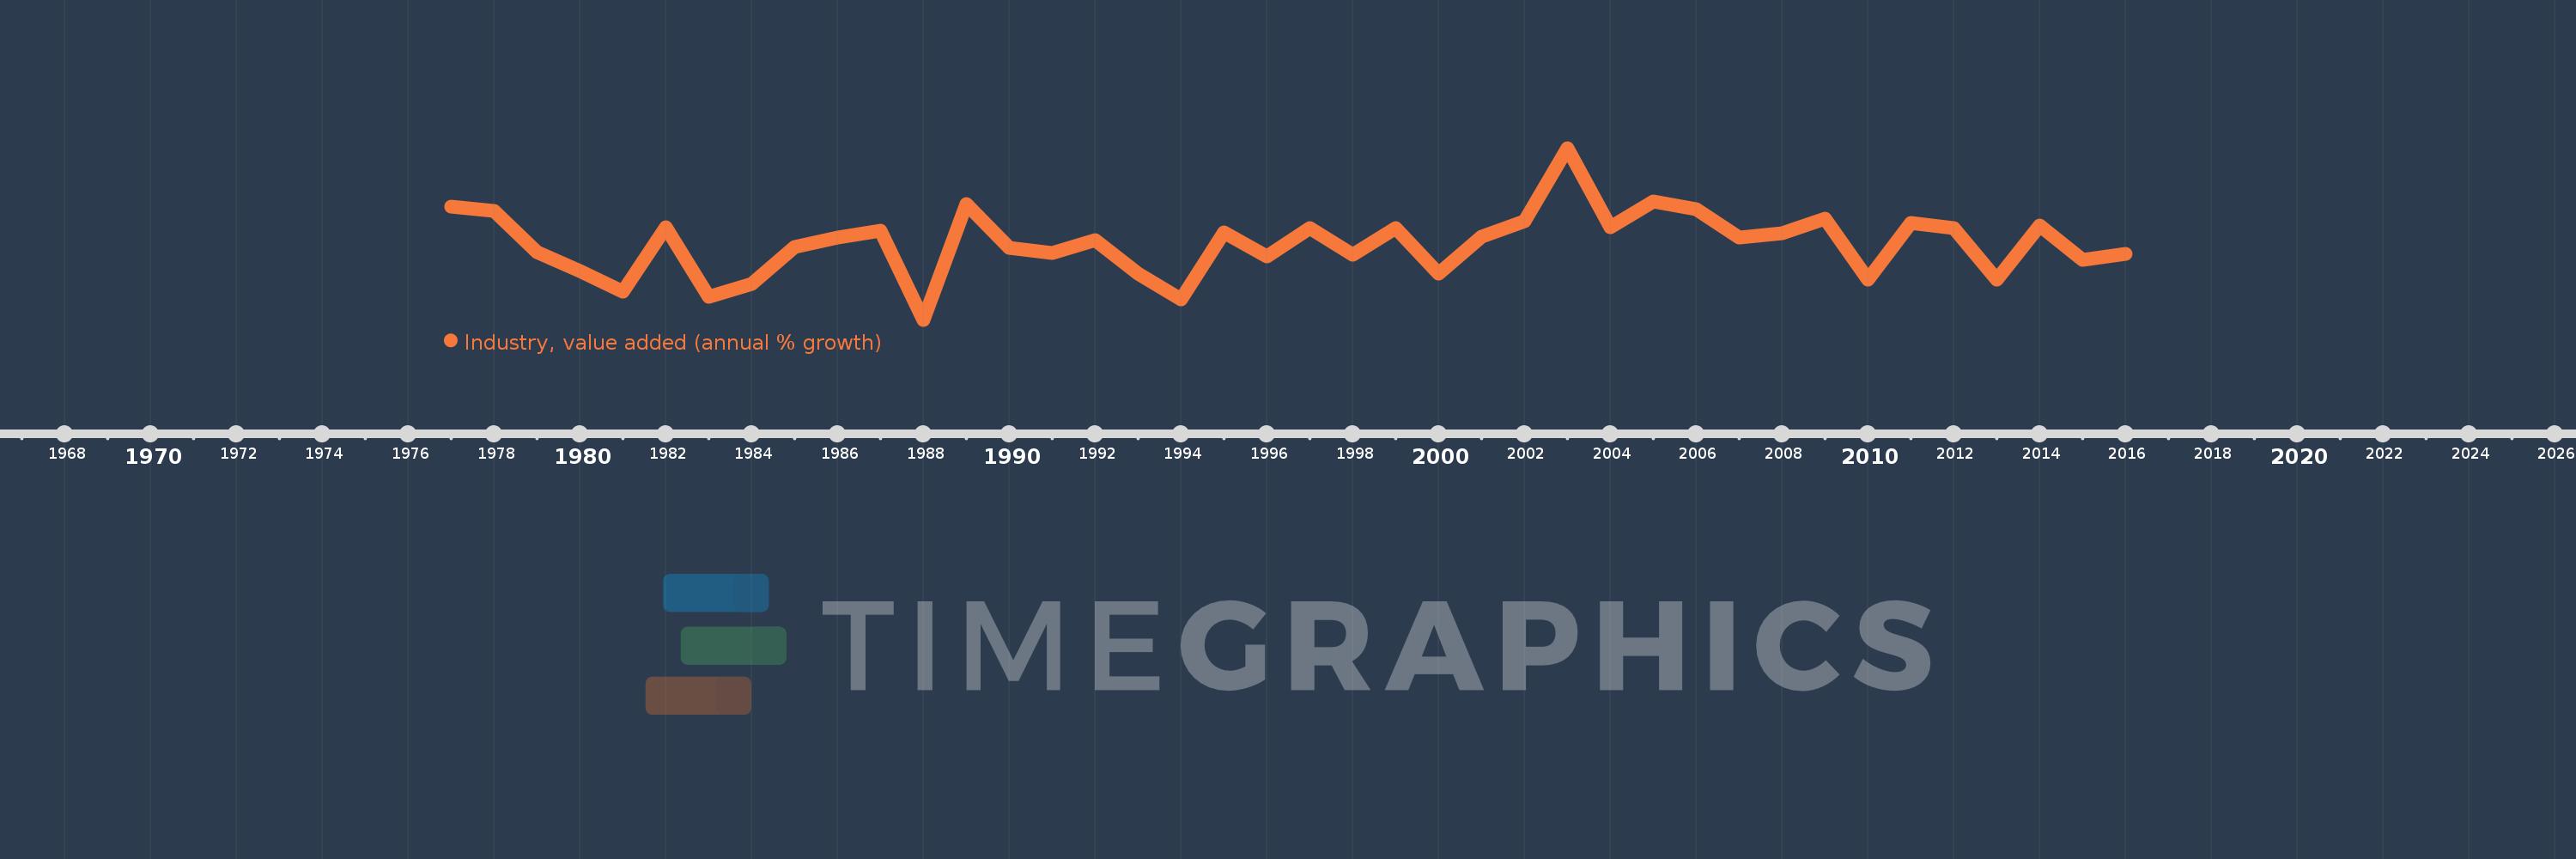
Industry, value added (annual % growth)
2016,2015,2014,2013,2012,2011,2010,2009,2008,2007,2006,2005,2004,2003,2002,2001,2000,1999,1998,1997,1996,1995,1994,1993,1992,1991,1990,1989,1988,1987,1986,1985,1984,1983,1982,1981,1980,1979,1978,1977
This statistics in other country:
AfghanistanAlbaniaAlgeriaAntigua and BarbudaArab WorldArgentinaArmeniaAustraliaAustriaAzerbaijanBahamas, TheBahrainBangladeshBelarusBelgiumBelizeBeninBermudaBhutanBoliviaBosnia and HerzegovinaBotswanaBrazilBrunei DarussalamBulgariaBurkina FasoBurundiCabo VerdeCambodiaCameroonCanadaCaribbean small statesCayman IslandsCentral African RepublicCentral Europe and the BalticsChadChileChinaColombiaComorosCongo, Dem. Rep.Congo, Rep.Costa RicaCote d'IvoireCroatiaCubaCyprusCzech RepublicDenmarkDjiboutiDominicaDominican RepublicEarly-demographic dividendEast Asia & PacificEast Asia & Pacific (excluding high income)East Asia & Pacific (IDA & IBRD countries)EcuadorEgypt, Arab Rep.El SalvadorEquatorial GuineaEritreaEstoniaEthiopiaEuro areaEurope & Central AsiaEurope & Central Asia (excluding high income)Europe & Central Asia (IDA & IBRD countries)European UnionFijiFinlandFragile and conflict affected situationsFranceGabonGambia, TheGeorgiaGermanyGhanaGreeceGrenadaGuatemalaGuineaGuinea-BissauGuyanaHaitiHeavily indebted poor countries (HIPC)High incomeHondurasHong Kong SAR, ChinaHungaryIBRD onlyIcelandIDA & IBRD totalIDA blendIDA onlyIDA totalIndiaIndonesiaIran, Islamic Rep.IraqIrelandItalyJamaicaJapanJordanKazakhstanKenyaKiribatiKorea, Rep.KosovoKuwaitKyrgyz RepublicLao PDRLate-demographic dividendLatin America & Caribbean Latin America & Caribbean (excluding high income)Latin America & the Caribbean (IDA & IBRD countries)LatviaLeast developed countries: UN classificationLebanonLesothoLiberiaLithuaniaLow & middle incomeLow incomeLower middle incomeLuxembourgMacedonia, FYRMadagascarMalawiMalaysiaMaldivesMaliMarshall IslandsMauritaniaMauritiusMexicoMicronesia, Fed. Sts.Middle East & North AfricaMiddle East & North Africa (excluding high income)Middle East & North Africa (IDA & IBRD countries)Middle incomeMoldovaMongoliaMontenegroMoroccoMozambiqueMyanmarNamibiaNepalNetherlandsNew ZealandNicaraguaNigerNigeriaNorth AmericaNorwayOECD membersOmanOther small statesPacific island small statesPakistanPalauPanamaPapua New GuineaParaguayPeruPhilippinesPolandPortugalPost-demographic dividendPre-demographic dividendPuerto RicoQatarRomaniaRussian FederationRwandaSamoaSao Tome and PrincipeSaudi ArabiaSenegalSerbiaSeychellesSierra LeoneSingaporeSlovak RepublicSloveniaSmall statesSolomon IslandsSomaliaSouth AfricaSouth AsiaSouth Asia (IDA & IBRD)SpainSri LankaSt. Kitts and NevisSt. LuciaSt. Vincent and the GrenadinesSub-Saharan Africa Sub-Saharan Africa (excluding high income)Sub-Saharan Africa (IDA & IBRD countries)SudanSurinameSwazilandSwedenSwitzerlandSyrian Arab RepublicTajikistanTanzaniaThailandTimor-LesteTogoTongaTrinidad and TobagoTunisiaTurkeyTurkmenistanTuvaluUgandaUkraineUnited Arab EmiratesUnited KingdomUnited StatesUpper middle incomeUruguayUzbekistanVanuatuVenezuela, RBVietnamWest Bank and GazaWorldZambiaZimbabwe Timeline:
This timeline shows a graph from 1977 to 2016 of Suriname. No data until 1976. Number of actual observations by date: 40.
Source name:
World Development Indicators
Source organization:
World Bank national accounts data, and OECD National Accounts data files.
Categories, topics:
Economy & Growth
Last updated:
apr 23, 2017
Indicators value changes by year
Minimum:
-20.449
jan 1, 1988
Maximum:
28.288
jan 1, 2003
At the date of observation
Value
Absolute change
Change from previous value
jan 1, 1977
11.745
+11.745
0.0%
jan 1, 1978
10.323
-1.423
-12.11%
jan 1, 1979
-1.328
-11.651
-112.87%
jan 1, 1980
-6.531
-5.203
391.8%
jan 1, 1981
-12.567
-6.036
92.42%
jan 1, 1982
5.702
+18.27
-145.38%
jan 1, 1983
-13.87
-19.573
-343.23%
jan 1, 1984
-10.255
+3.615
-26.07%
jan 1, 1985
0.094
+10.349
-100.92%
jan 1, 1986
2.968
+2.874
3.06K%
jan 1, 1987
4.916
+1.948
65.62%
jan 1, 1988
-20.449
-25.364
-515.98%
jan 1, 1989
12.272
+32.721
-160.01%
jan 1, 1990
0.007
-12.265
-99.94%
jan 1, 1991
-1.497
-1.503
-21.73K%
jan 1, 1992
2.117
+3.614
-241.47%
jan 1, 1993
-7.442
-9.56
-451.51%
jan 1, 1994
-14.735
-7.293
97.99%
jan 1, 1995
4.32
+19.055
-129.32%
jan 1, 1996
-2.419
-6.739
-156.0%
jan 1, 1997
5.448
+7.867
-325.2%
jan 1, 1998
-1.889
-7.337
-134.68%
jan 1, 1999
5.444
+7.333
-388.21%
jan 1, 2000
-7.291
-12.735
-233.92%
jan 1, 2001
3.01
+10.301
-141.28%
jan 1, 2002
7.601
+4.591
152.53%
jan 1, 2003
28.288
+20.688
272.18%
jan 1, 2004
5.744
-22.545
-79.7%
jan 1, 2005
13.224
+7.48
130.24%
jan 1, 2006
10.798
-2.426
-18.35%
jan 1, 2007
2.974
-7.824
-72.46%
jan 1, 2008
3.985
+1.011
33.99%
jan 1, 2009
8.164
+4.179
104.88%
jan 1, 2010
-8.996
-17.16
-210.19%
jan 1, 2011
7.075
+16.071
-178.65%
jan 1, 2012
5.628
-1.448
-20.46%
jan 1, 2013
-9.009
-14.637
-260.09%
jan 1, 2014
6.382
+15.391
-170.83%
jan 1, 2015
-3.432
-9.814
-153.78%
jan 1, 2016
-1.806
+1.626
-47.37%
Ranking of countries by current statistics by years


Comments: