29
/
en
AIzaSyAYiBZKx7MnpbEhh9jyipgxe19OcubqV5w
April 1, 2024
121060
Dominica
DMA
true
2
1
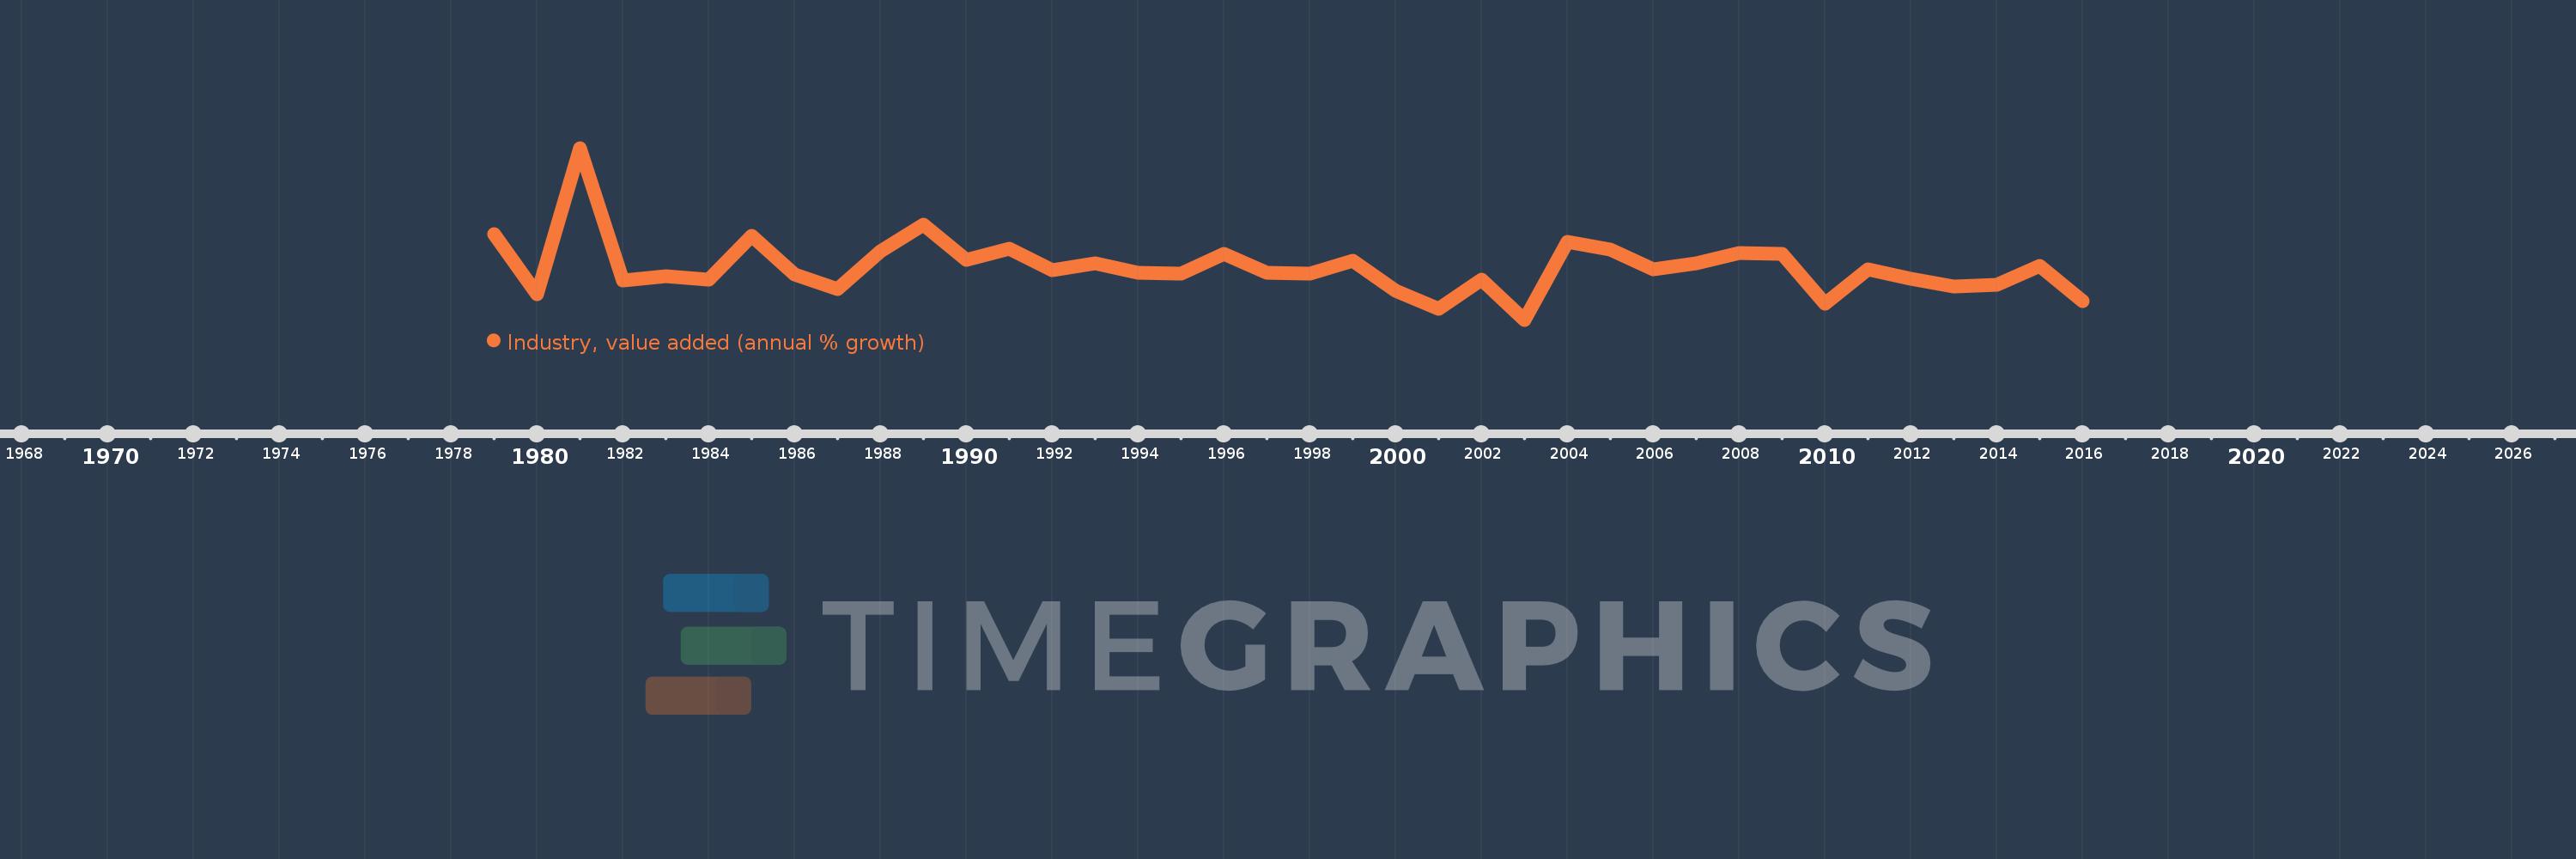
Industry, value added (annual % growth)
2016,2015,2014,2013,2012,2011,2010,2009,2008,2007,2006,2005,2004,2003,2002,2001,2000,1999,1998,1997,1996,1995,1994,1993,1992,1991,1990,1989,1988,1987,1986,1985,1984,1983,1982,1981,1980,1979
This statistics in other country:
AfghanistanAlbaniaAlgeriaAntigua and BarbudaArab WorldArgentinaArmeniaAustraliaAustriaAzerbaijanBahamas, TheBahrainBangladeshBelarusBelgiumBelizeBeninBermudaBhutanBoliviaBosnia and HerzegovinaBotswanaBrazilBrunei DarussalamBulgariaBurkina FasoBurundiCabo VerdeCambodiaCameroonCanadaCaribbean small statesCayman IslandsCentral African RepublicCentral Europe and the BalticsChadChileChinaColombiaComorosCongo, Dem. Rep.Congo, Rep.Costa RicaCote d'IvoireCroatiaCubaCyprusCzech RepublicDenmarkDjiboutiDominicaDominican RepublicEarly-demographic dividendEast Asia & PacificEast Asia & Pacific (excluding high income)East Asia & Pacific (IDA & IBRD countries)EcuadorEgypt, Arab Rep.El SalvadorEquatorial GuineaEritreaEstoniaEthiopiaEuro areaEurope & Central AsiaEurope & Central Asia (excluding high income)Europe & Central Asia (IDA & IBRD countries)European UnionFijiFinlandFragile and conflict affected situationsFranceGabonGambia, TheGeorgiaGermanyGhanaGreeceGrenadaGuatemalaGuineaGuinea-BissauGuyanaHaitiHeavily indebted poor countries (HIPC)High incomeHondurasHong Kong SAR, ChinaHungaryIBRD onlyIcelandIDA & IBRD totalIDA blendIDA onlyIDA totalIndiaIndonesiaIran, Islamic Rep.IraqIrelandItalyJamaicaJapanJordanKazakhstanKenyaKiribatiKorea, Rep.KosovoKuwaitKyrgyz RepublicLao PDRLate-demographic dividendLatin America & Caribbean Latin America & Caribbean (excluding high income)Latin America & the Caribbean (IDA & IBRD countries)LatviaLeast developed countries: UN classificationLebanonLesothoLiberiaLithuaniaLow & middle incomeLow incomeLower middle incomeLuxembourgMacedonia, FYRMadagascarMalawiMalaysiaMaldivesMaliMarshall IslandsMauritaniaMauritiusMexicoMicronesia, Fed. Sts.Middle East & North AfricaMiddle East & North Africa (excluding high income)Middle East & North Africa (IDA & IBRD countries)Middle incomeMoldovaMongoliaMontenegroMoroccoMozambiqueMyanmarNamibiaNepalNetherlandsNew ZealandNicaraguaNigerNigeriaNorth AmericaNorwayOECD membersOmanOther small statesPacific island small statesPakistanPalauPanamaPapua New GuineaParaguayPeruPhilippinesPolandPortugalPost-demographic dividendPre-demographic dividendPuerto RicoQatarRomaniaRussian FederationRwandaSamoaSao Tome and PrincipeSaudi ArabiaSenegalSerbiaSeychellesSierra LeoneSingaporeSlovak RepublicSloveniaSmall statesSolomon IslandsSomaliaSouth AfricaSouth AsiaSouth Asia (IDA & IBRD)SpainSri LankaSt. Kitts and NevisSt. LuciaSt. Vincent and the GrenadinesSub-Saharan Africa Sub-Saharan Africa (excluding high income)Sub-Saharan Africa (IDA & IBRD countries)SudanSurinameSwazilandSwedenSwitzerlandSyrian Arab RepublicTajikistanTanzaniaThailandTimor-LesteTogoTongaTrinidad and TobagoTunisiaTurkeyTurkmenistanTuvaluUgandaUkraineUnited Arab EmiratesUnited KingdomUnited StatesUpper middle incomeUruguayUzbekistanVanuatuVenezuela, RBVietnamWest Bank and GazaWorldZambiaZimbabwe Timeline:
This timeline shows a graph from 1979 to 2016 of Dominica. No data until 1978. Number of actual observations by date: 38.
Source name:
World Development Indicators
Source organization:
World Bank national accounts data, and OECD National Accounts data files.
Categories, topics:
Economy & Growth
Last updated:
apr 23, 2017
Indicators value changes by year
Minimum:
-13.46
jan 1, 2003
Maximum:
42.541
jan 1, 1981
At the date of observation
Value
Absolute change
Change from previous value
jan 1, 1979
14.545
+14.545
0.0%
jan 1, 1980
-5.137
-19.682
-135.32%
jan 1, 1981
42.541
+47.678
-928.09%
jan 1, 1982
-0.741
-43.281
-101.74%
jan 1, 1983
0.626
+1.367
-184.49%
jan 1, 1984
-0.287
-0.913
-145.87%
jan 1, 1985
13.772
+14.059
-4.9K%
jan 1, 1986
1.244
-12.528
-90.97%
jan 1, 1987
-3.541
-4.785
-384.61%
jan 1, 1988
8.853
+12.394
-350.03%
jan 1, 1989
17.437
+8.584
96.95%
jan 1, 1990
6.03
-11.407
-65.42%
jan 1, 1991
9.686
+3.656
60.62%
jan 1, 1992
2.701
-6.985
-72.11%
jan 1, 1993
4.893
+2.192
81.13%
jan 1, 1994
1.726
-3.168
-64.73%
jan 1, 1995
1.537
-0.188
-10.91%
jan 1, 1996
7.884
+6.347
412.79%
jan 1, 1997
1.863
-6.021
-76.37%
jan 1, 1998
1.699
-0.165
-8.84%
jan 1, 1999
5.641
+3.943
232.11%
jan 1, 2000
-4.157
-9.798
-173.69%
jan 1, 2001
-9.972
-5.815
139.9%
jan 1, 2002
-0.413
+9.559
-95.86%
jan 1, 2003
-13.46
-13.047
3.16K%
jan 1, 2004
11.942
+25.402
-188.72%
jan 1, 2005
9.442
-2.499
-20.93%
jan 1, 2006
2.961
-6.481
-68.64%
jan 1, 2007
5.059
+2.098
70.84%
jan 1, 2008
8.221
+3.162
62.51%
jan 1, 2009
8.06
-0.161
-1.96%
jan 1, 2010
-8.096
-16.156
-200.44%
jan 1, 2011
2.875
+10.971
-135.52%
jan 1, 2012
-0.094
-2.969
-103.26%
jan 1, 2013
-2.509
-2.415
2.57K%
jan 1, 2014
-2.005
+0.504
-20.07%
jan 1, 2015
4.114
+6.119
-305.13%
jan 1, 2016
-7.506
-11.619
-282.46%
Ranking of countries by current statistics by years


Comments: