29
/
en
AIzaSyAYiBZKx7MnpbEhh9jyipgxe19OcubqV5w
April 1, 2024
112397
Costa Rica
CRI
true
2
1
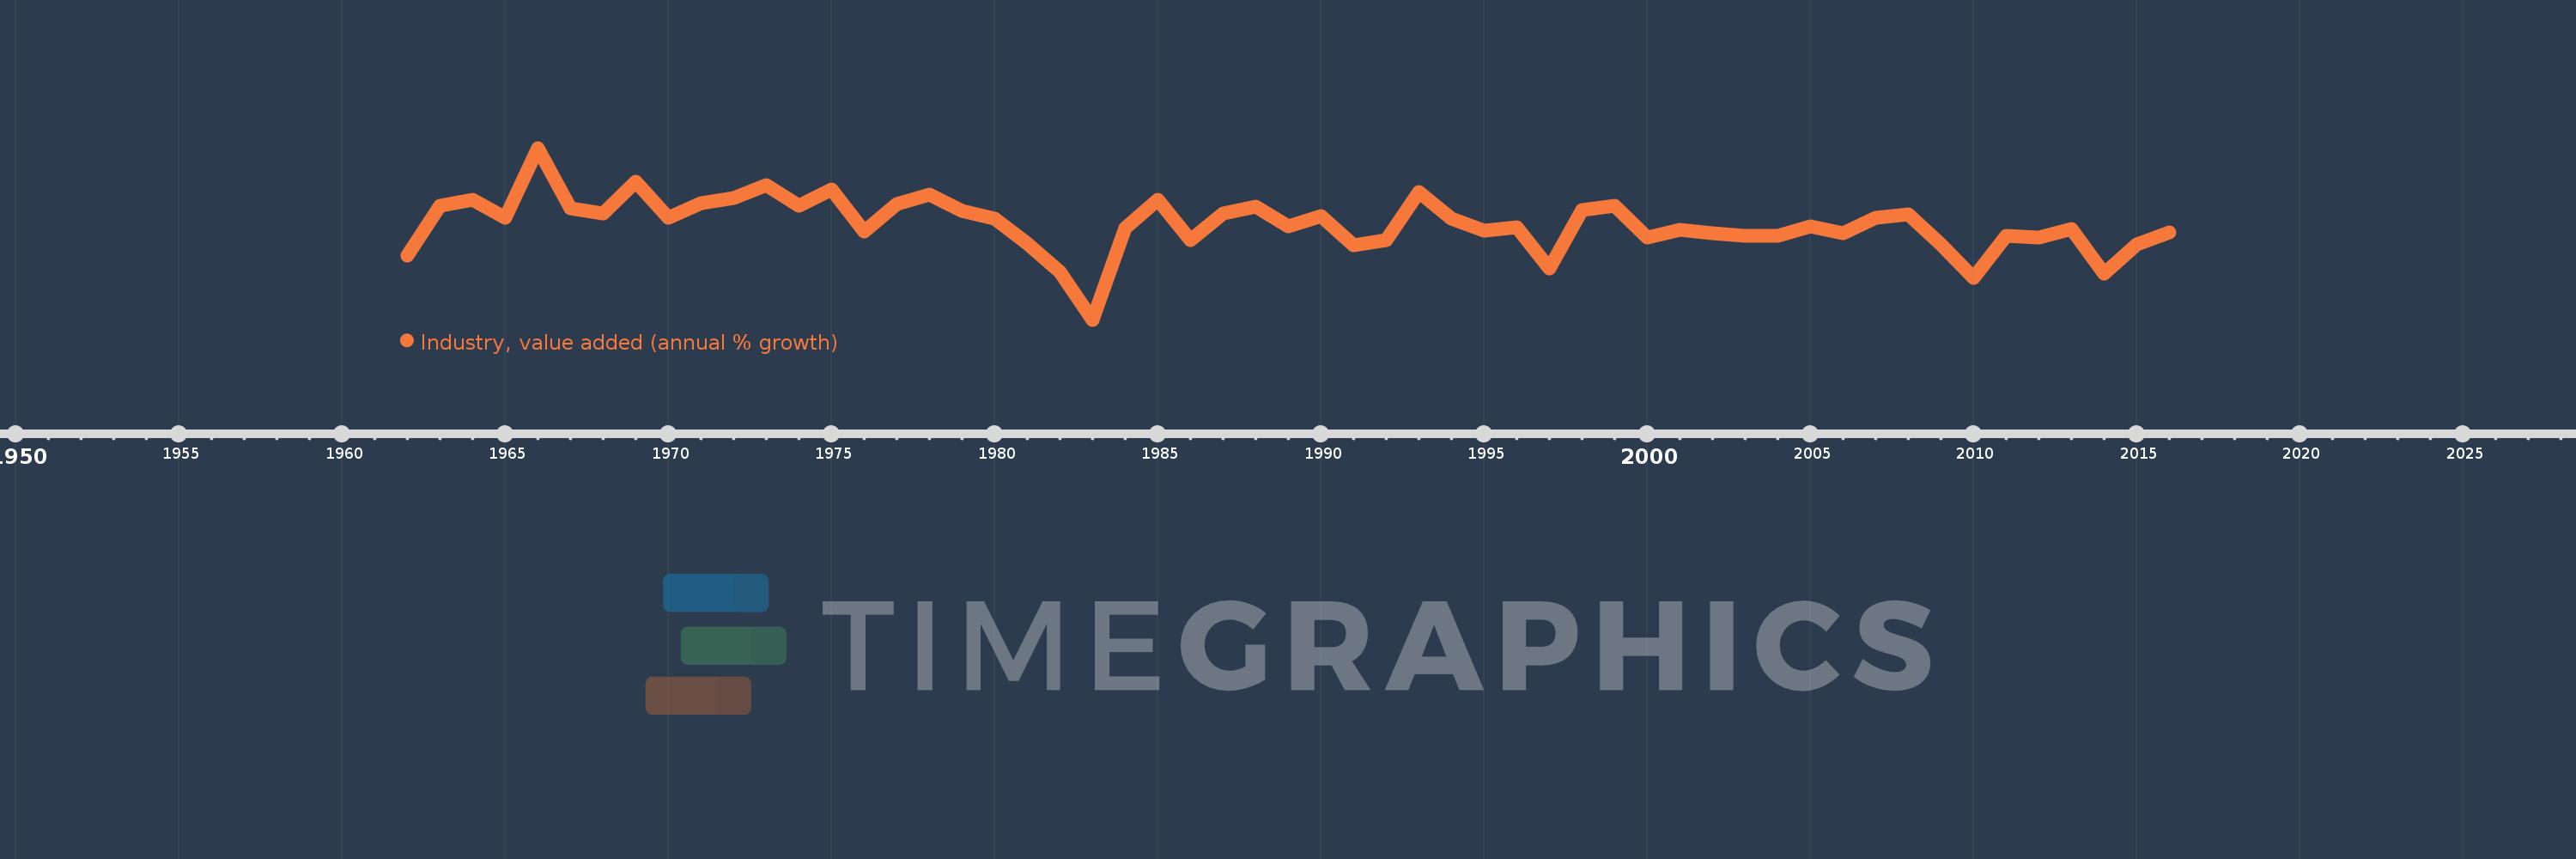
Industry, value added (annual % growth)
2016,2015,2014,2013,2012,2011,2010,2009,2008,2007,2006,2005,2004,2003,2002,2001,2000,1999,1998,1997,1996,1995,1994,1993,1992,1991,1990,1989,1988,1987,1986,1985,1984,1983,1982,1981,1980,1979,1978,1977,1976,1975,1974,1973,1972,1971,1970,1969,1968,1967,1966,1965,1964,1963,1962
This statistics in other country:
AfghanistanAlbaniaAlgeriaAntigua and BarbudaArab WorldArgentinaArmeniaAustraliaAustriaAzerbaijanBahamas, TheBahrainBangladeshBelarusBelgiumBelizeBeninBermudaBhutanBoliviaBosnia and HerzegovinaBotswanaBrazilBrunei DarussalamBulgariaBurkina FasoBurundiCabo VerdeCambodiaCameroonCanadaCaribbean small statesCayman IslandsCentral African RepublicCentral Europe and the BalticsChadChileChinaColombiaComorosCongo, Dem. Rep.Congo, Rep.Costa RicaCote d'IvoireCroatiaCubaCyprusCzech RepublicDenmarkDjiboutiDominicaDominican RepublicEarly-demographic dividendEast Asia & PacificEast Asia & Pacific (excluding high income)East Asia & Pacific (IDA & IBRD countries)EcuadorEgypt, Arab Rep.El SalvadorEquatorial GuineaEritreaEstoniaEthiopiaEuro areaEurope & Central AsiaEurope & Central Asia (excluding high income)Europe & Central Asia (IDA & IBRD countries)European UnionFijiFinlandFragile and conflict affected situationsFranceGabonGambia, TheGeorgiaGermanyGhanaGreeceGrenadaGuatemalaGuineaGuinea-BissauGuyanaHaitiHeavily indebted poor countries (HIPC)High incomeHondurasHong Kong SAR, ChinaHungaryIBRD onlyIcelandIDA & IBRD totalIDA blendIDA onlyIDA totalIndiaIndonesiaIran, Islamic Rep.IraqIrelandItalyJamaicaJapanJordanKazakhstanKenyaKiribatiKorea, Rep.KosovoKuwaitKyrgyz RepublicLao PDRLate-demographic dividendLatin America & Caribbean Latin America & Caribbean (excluding high income)Latin America & the Caribbean (IDA & IBRD countries)LatviaLeast developed countries: UN classificationLebanonLesothoLiberiaLithuaniaLow & middle incomeLow incomeLower middle incomeLuxembourgMacedonia, FYRMadagascarMalawiMalaysiaMaldivesMaliMarshall IslandsMauritaniaMauritiusMexicoMicronesia, Fed. Sts.Middle East & North AfricaMiddle East & North Africa (excluding high income)Middle East & North Africa (IDA & IBRD countries)Middle incomeMoldovaMongoliaMontenegroMoroccoMozambiqueMyanmarNamibiaNepalNetherlandsNew ZealandNicaraguaNigerNigeriaNorth AmericaNorwayOECD membersOmanOther small statesPacific island small statesPakistanPalauPanamaPapua New GuineaParaguayPeruPhilippinesPolandPortugalPost-demographic dividendPre-demographic dividendPuerto RicoQatarRomaniaRussian FederationRwandaSamoaSao Tome and PrincipeSaudi ArabiaSenegalSerbiaSeychellesSierra LeoneSingaporeSlovak RepublicSloveniaSmall statesSolomon IslandsSomaliaSouth AfricaSouth AsiaSouth Asia (IDA & IBRD)SpainSri LankaSt. Kitts and NevisSt. LuciaSt. Vincent and the GrenadinesSub-Saharan Africa Sub-Saharan Africa (excluding high income)Sub-Saharan Africa (IDA & IBRD countries)SudanSurinameSwazilandSwedenSwitzerlandSyrian Arab RepublicTajikistanTanzaniaThailandTimor-LesteTogoTongaTrinidad and TobagoTunisiaTurkeyTurkmenistanTuvaluUgandaUkraineUnited Arab EmiratesUnited KingdomUnited StatesUpper middle incomeUruguayUzbekistanVanuatuVenezuela, RBVietnamWest Bank and GazaWorldZambiaZimbabwe Timeline:
This timeline shows a graph from 1962 to 2016 of Costa Rica. No data until 1961. Number of actual observations by date: 55.
Source name:
World Development Indicators
Source organization:
World Bank national accounts data, and OECD National Accounts data files.
Categories, topics:
Economy & Growth
Last updated:
apr 23, 2017
Indicators value changes by year
Minimum:
-13.484
jan 1, 1983
Maximum:
19.589
jan 1, 1966
At the date of observation
Value
Absolute change
Change from previous value
jan 1, 1962
-1.053
-1.053
0.0%
jan 1, 1963
8.446
+9.498
-902.2%
jan 1, 1964
9.627
+1.182
13.99%
jan 1, 1965
6.223
-3.405
-35.36%
jan 1, 1966
19.589
+13.366
214.79%
jan 1, 1967
7.904
-11.685
-59.65%
jan 1, 1968
7.05
-0.854
-10.81%
jan 1, 1969
13.056
+6.007
85.21%
jan 1, 1970
6.187
-6.869
-52.61%
jan 1, 1971
8.899
+2.712
43.83%
jan 1, 1972
10.016
+1.117
12.55%
jan 1, 1973
12.477
+2.461
24.57%
jan 1, 1974
8.518
-3.958
-31.73%
jan 1, 1975
11.557
+3.039
35.68%
jan 1, 1976
3.547
-8.01
-69.31%
jan 1, 1977
8.732
+5.184
146.14%
jan 1, 1978
10.533
+1.801
20.63%
jan 1, 1979
7.547
-2.986
-28.35%
jan 1, 1980
5.926
-1.62
-21.47%
jan 1, 1981
1.16
-4.766
-80.42%
jan 1, 1982
-4.204
-5.364
-462.36%
jan 1, 1983
-13.484
-9.28
220.75%
jan 1, 1984
4.082
+17.566
-130.27%
jan 1, 1985
9.588
+5.506
134.9%
jan 1, 1986
1.845
-7.743
-80.76%
jan 1, 1987
6.976
+5.131
278.09%
jan 1, 1988
8.331
+1.355
19.43%
jan 1, 1989
4.528
-3.803
-45.65%
jan 1, 1990
6.416
+1.888
41.7%
jan 1, 1991
0.879
-5.537
-86.3%
jan 1, 1992
1.892
+1.013
115.19%
jan 1, 1993
11.079
+9.187
485.65%
jan 1, 1994
6.052
-5.027
-45.37%
jan 1, 1995
3.635
-2.418
-39.95%
jan 1, 1996
4.262
+0.628
17.27%
jan 1, 1997
-3.542
-7.804
-183.1%
jan 1, 1998
7.61
+11.152
-314.86%
jan 1, 1999
8.465
+0.855
11.23%
jan 1, 2000
2.323
-6.142
-72.56%
jan 1, 2001
3.831
+1.508
64.94%
jan 1, 2002
3.244
-0.588
-15.34%
jan 1, 2003
2.632
-0.612
-18.86%
jan 1, 2004
2.715
+0.083
3.14%
jan 1, 2005
4.562
+1.847
68.05%
jan 1, 2006
3.169
-1.393
-30.53%
jan 1, 2007
6.13
+2.961
93.45%
jan 1, 2008
6.819
+0.689
11.24%
jan 1, 2009
1.076
-5.743
-84.22%
jan 1, 2010
-5.504
-6.58
-611.37%
jan 1, 2011
2.605
+8.109
-147.34%
jan 1, 2012
2.4
-0.205
-7.86%
jan 1, 2013
3.99
+1.589
66.19%
jan 1, 2014
-4.617
-8.606
-215.73%
jan 1, 2015
0.99
+5.607
-121.44%
jan 1, 2016
3.415
+2.425
245.03%
Ranking of countries by current statistics by years


Comments: