29
/
en
AIzaSyAYiBZKx7MnpbEhh9jyipgxe19OcubqV5w
April 1, 2024
222335
Peru
PER
true
2
1
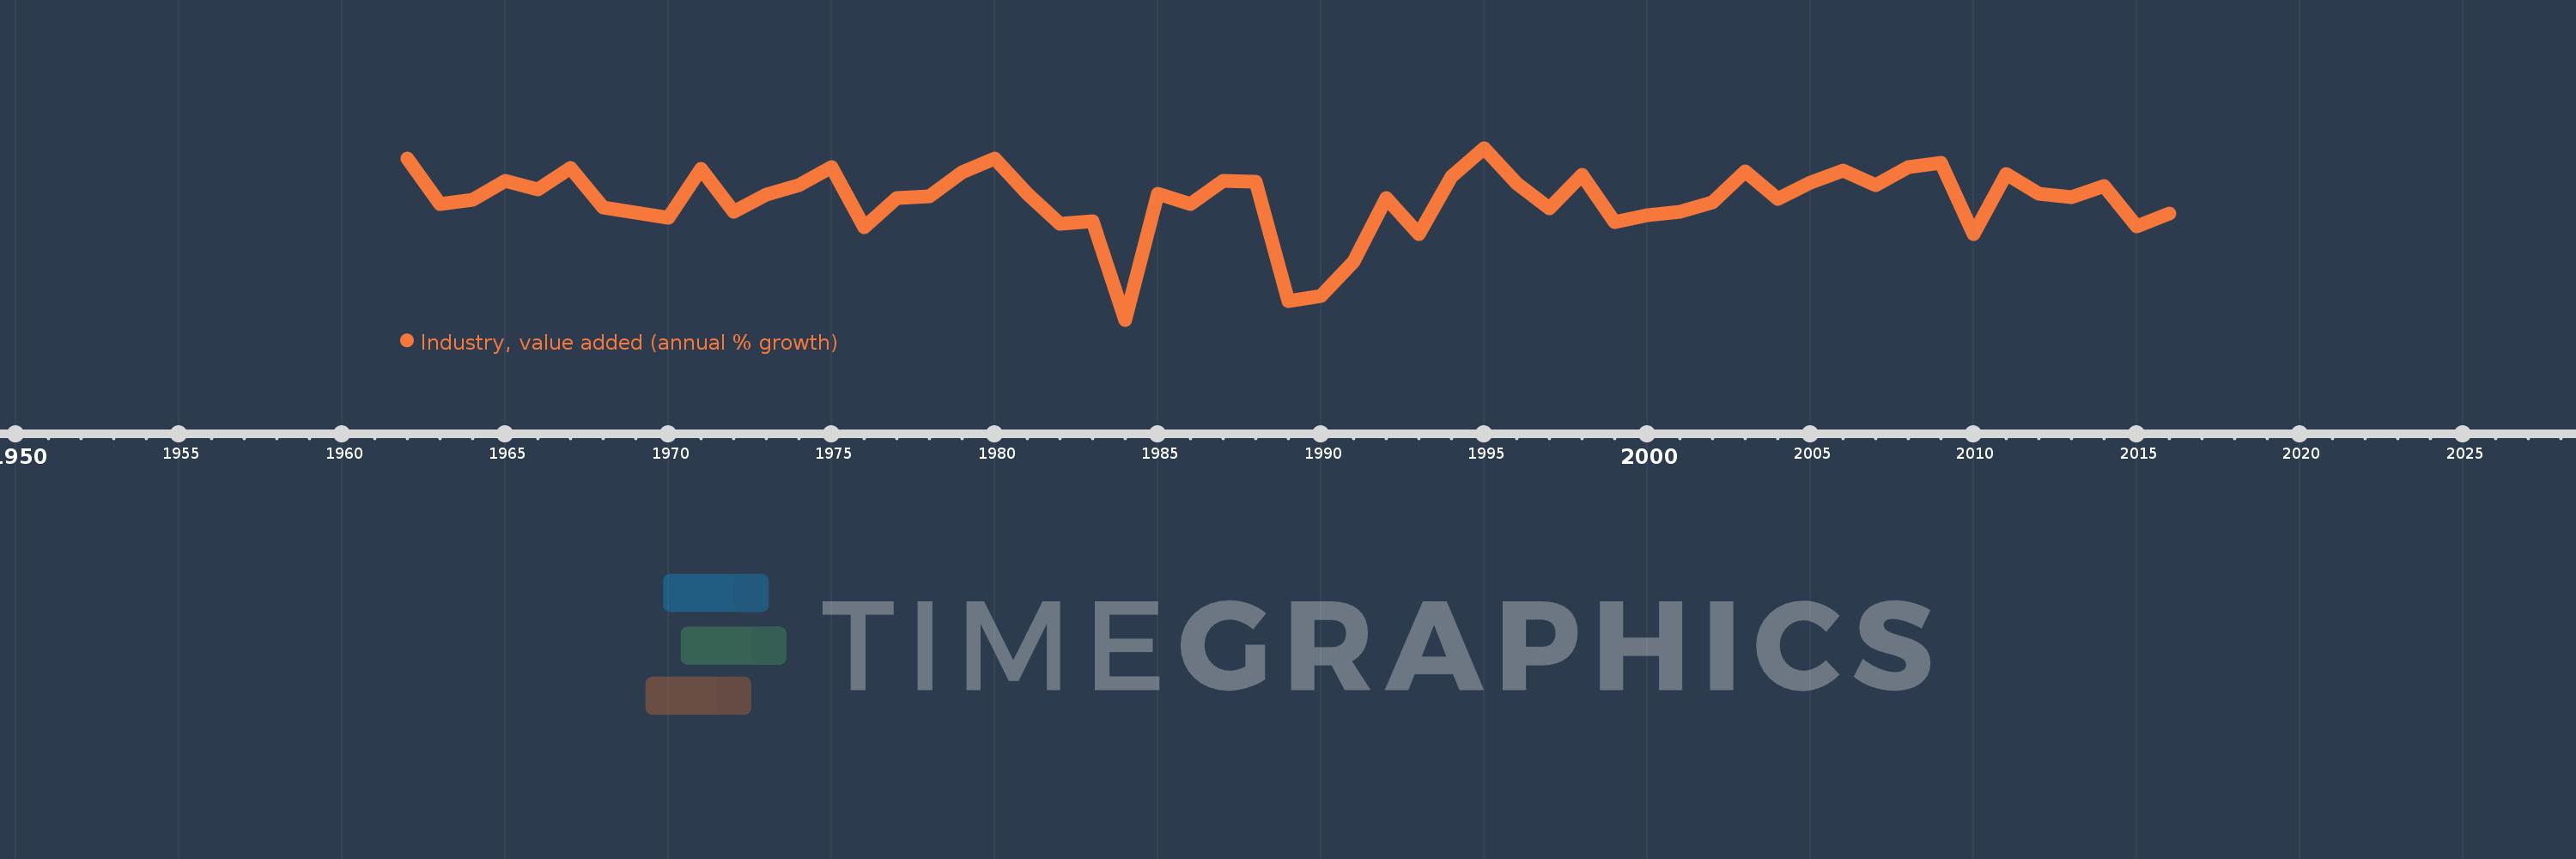
Industry, value added (annual % growth)
2016,2015,2014,2013,2012,2011,2010,2009,2008,2007,2006,2005,2004,2003,2002,2001,2000,1999,1998,1997,1996,1995,1994,1993,1992,1991,1990,1989,1988,1987,1986,1985,1984,1983,1982,1981,1980,1979,1978,1977,1976,1975,1974,1973,1972,1971,1970,1969,1968,1967,1966,1965,1964,1963,1962
This statistics in other country:
AfghanistanAlbaniaAlgeriaAntigua and BarbudaArab WorldArgentinaArmeniaAustraliaAustriaAzerbaijanBahamas, TheBahrainBangladeshBelarusBelgiumBelizeBeninBermudaBhutanBoliviaBosnia and HerzegovinaBotswanaBrazilBrunei DarussalamBulgariaBurkina FasoBurundiCabo VerdeCambodiaCameroonCanadaCaribbean small statesCayman IslandsCentral African RepublicCentral Europe and the BalticsChadChileChinaColombiaComorosCongo, Dem. Rep.Congo, Rep.Costa RicaCote d'IvoireCroatiaCubaCyprusCzech RepublicDenmarkDjiboutiDominicaDominican RepublicEarly-demographic dividendEast Asia & PacificEast Asia & Pacific (excluding high income)East Asia & Pacific (IDA & IBRD countries)EcuadorEgypt, Arab Rep.El SalvadorEquatorial GuineaEritreaEstoniaEthiopiaEuro areaEurope & Central AsiaEurope & Central Asia (excluding high income)Europe & Central Asia (IDA & IBRD countries)European UnionFijiFinlandFragile and conflict affected situationsFranceGabonGambia, TheGeorgiaGermanyGhanaGreeceGrenadaGuatemalaGuineaGuinea-BissauGuyanaHaitiHeavily indebted poor countries (HIPC)High incomeHondurasHong Kong SAR, ChinaHungaryIBRD onlyIcelandIDA & IBRD totalIDA blendIDA onlyIDA totalIndiaIndonesiaIran, Islamic Rep.IraqIrelandItalyJamaicaJapanJordanKazakhstanKenyaKiribatiKorea, Rep.KosovoKuwaitKyrgyz RepublicLao PDRLate-demographic dividendLatin America & Caribbean Latin America & Caribbean (excluding high income)Latin America & the Caribbean (IDA & IBRD countries)LatviaLeast developed countries: UN classificationLebanonLesothoLiberiaLithuaniaLow & middle incomeLow incomeLower middle incomeLuxembourgMacedonia, FYRMadagascarMalawiMalaysiaMaldivesMaliMarshall IslandsMauritaniaMauritiusMexicoMicronesia, Fed. Sts.Middle East & North AfricaMiddle East & North Africa (excluding high income)Middle East & North Africa (IDA & IBRD countries)Middle incomeMoldovaMongoliaMontenegroMoroccoMozambiqueMyanmarNamibiaNepalNetherlandsNew ZealandNicaraguaNigerNigeriaNorth AmericaNorwayOECD membersOmanOther small statesPacific island small statesPakistanPalauPanamaPapua New GuineaParaguayPeruPhilippinesPolandPortugalPost-demographic dividendPre-demographic dividendPuerto RicoQatarRomaniaRussian FederationRwandaSamoaSao Tome and PrincipeSaudi ArabiaSenegalSerbiaSeychellesSierra LeoneSingaporeSlovak RepublicSloveniaSmall statesSolomon IslandsSomaliaSouth AfricaSouth AsiaSouth Asia (IDA & IBRD)SpainSri LankaSt. Kitts and NevisSt. LuciaSt. Vincent and the GrenadinesSub-Saharan Africa Sub-Saharan Africa (excluding high income)Sub-Saharan Africa (IDA & IBRD countries)SudanSurinameSwazilandSwedenSwitzerlandSyrian Arab RepublicTajikistanTanzaniaThailandTimor-LesteTogoTongaTrinidad and TobagoTunisiaTurkeyTurkmenistanTuvaluUgandaUkraineUnited Arab EmiratesUnited KingdomUnited StatesUpper middle incomeUruguayUzbekistanVanuatuVenezuela, RBVietnamWest Bank and GazaWorldZambiaZimbabwe Timeline:
This timeline shows a graph from 1962 to 2016 of Peru. No data until 1961. Number of actual observations by date: 55.
Source name:
World Development Indicators
Source organization:
World Bank national accounts data, and OECD National Accounts data files.
Categories, topics:
Economy & Growth
Last updated:
apr 23, 2017
Indicators value changes by year
Minimum:
-14.724
jan 1, 1984
Maximum:
11.731
jan 1, 1995
At the date of observation
Value
Absolute change
Change from previous value
jan 1, 1962
10.07
+10.07
0.0%
jan 1, 1963
3.028
-7.042
-69.93%
jan 1, 1964
3.693
+0.665
21.97%
jan 1, 1965
6.6
+2.907
78.73%
jan 1, 1966
5.359
-1.241
-18.81%
jan 1, 1967
8.619
+3.26
60.84%
jan 1, 1968
2.536
-6.083
-70.58%
jan 1, 1969
1.782
-0.753
-29.71%
jan 1, 1970
1.0
-0.782
-43.88%
jan 1, 1971
8.455
+7.454
745.16%
jan 1, 1972
1.853
-6.601
-78.08%
jan 1, 1973
4.495
+2.642
142.53%
jan 1, 1974
6.006
+1.511
33.62%
jan 1, 1975
8.843
+2.837
47.23%
jan 1, 1976
-0.427
-9.27
-104.82%
jan 1, 1977
4.065
+4.491
-1.05K%
jan 1, 1978
4.3
+0.236
5.8%
jan 1, 1979
7.958
+3.658
85.06%
jan 1, 1980
10.143
+2.185
27.46%
jan 1, 1981
4.73
-5.413
-53.37%
jan 1, 1982
0.108
-4.622
-97.71%
jan 1, 1983
0.428
+0.32
295.46%
jan 1, 1984
-14.724
-15.152
-3.54K%
jan 1, 1985
4.676
+19.399
-131.75%
jan 1, 1986
3.093
-1.582
-33.84%
jan 1, 1987
6.728
+3.635
117.5%
jan 1, 1988
6.494
-0.234
-3.47%
jan 1, 1989
-11.85
-18.344
-282.47%
jan 1, 1990
-11.099
+0.751
-6.34%
jan 1, 1991
-5.797
+5.301
-47.77%
jan 1, 1992
4.049
+9.846
-169.85%
jan 1, 1993
-1.544
-5.593
-138.14%
jan 1, 1994
7.384
+8.928
-578.17%
jan 1, 1995
11.731
+4.348
58.88%
jan 1, 1996
6.224
-5.507
-46.95%
jan 1, 1997
2.455
-3.769
-60.55%
jan 1, 1998
7.643
+5.188
211.29%
jan 1, 1999
0.314
-7.329
-95.89%
jan 1, 2000
1.326
+1.012
322.3%
jan 1, 2001
1.892
+0.565
42.63%
jan 1, 2002
3.318
+1.426
75.39%
jan 1, 2003
8.164
+4.846
146.06%
jan 1, 2004
3.912
-4.252
-52.08%
jan 1, 2005
6.458
+2.546
65.07%
jan 1, 2006
8.285
+1.826
28.28%
jan 1, 2007
5.965
-2.32
-28.0%
jan 1, 2008
8.717
+2.752
46.14%
jan 1, 2009
9.461
+0.745
8.55%
jan 1, 2010
-1.582
-11.043
-116.72%
jan 1, 2011
7.767
+9.349
-590.95%
jan 1, 2012
4.62
-3.147
-40.52%
jan 1, 2013
4.136
-0.483
-10.46%
jan 1, 2014
5.891
+1.755
42.43%
jan 1, 2015
-0.383
-6.275
-106.51%
jan 1, 2016
1.588
+1.972
-514.19%
Ranking of countries by current statistics by years


Comments: