29
/
en
AIzaSyAYiBZKx7MnpbEhh9jyipgxe19OcubqV5w
April 1, 2024
143109
Grenada
GRD
true
2
1
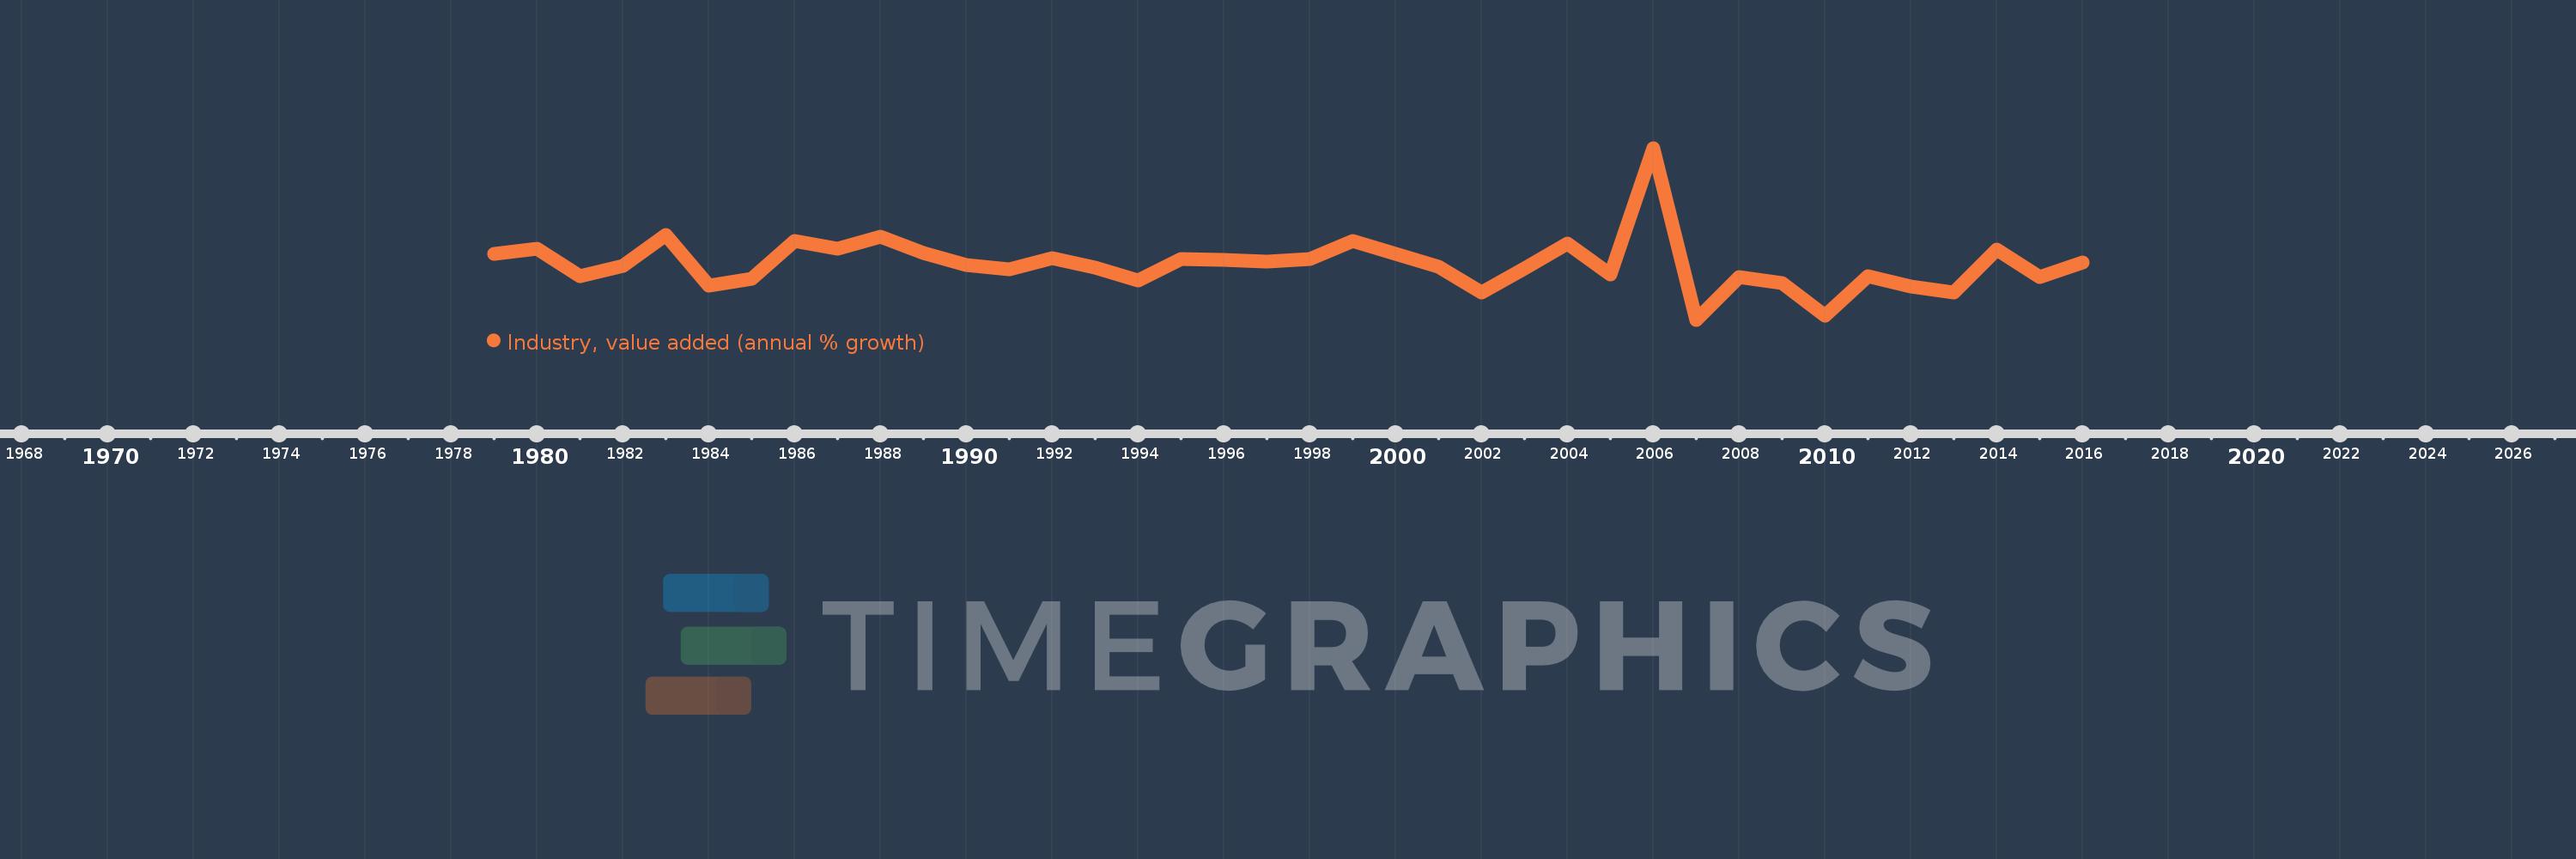
Industry, value added (annual % growth)
2016,2015,2014,2013,2012,2011,2010,2009,2008,2007,2006,2005,2004,2003,2002,2001,2000,1999,1998,1997,1996,1995,1994,1993,1992,1991,1990,1989,1988,1987,1986,1985,1984,1983,1982,1981,1980,1979
This statistics in other country:
AfghanistanAlbaniaAlgeriaAntigua and BarbudaArab WorldArgentinaArmeniaAustraliaAustriaAzerbaijanBahamas, TheBahrainBangladeshBelarusBelgiumBelizeBeninBermudaBhutanBoliviaBosnia and HerzegovinaBotswanaBrazilBrunei DarussalamBulgariaBurkina FasoBurundiCabo VerdeCambodiaCameroonCanadaCaribbean small statesCayman IslandsCentral African RepublicCentral Europe and the BalticsChadChileChinaColombiaComorosCongo, Dem. Rep.Congo, Rep.Costa RicaCote d'IvoireCroatiaCubaCyprusCzech RepublicDenmarkDjiboutiDominicaDominican RepublicEarly-demographic dividendEast Asia & PacificEast Asia & Pacific (excluding high income)East Asia & Pacific (IDA & IBRD countries)EcuadorEgypt, Arab Rep.El SalvadorEquatorial GuineaEritreaEstoniaEthiopiaEuro areaEurope & Central AsiaEurope & Central Asia (excluding high income)Europe & Central Asia (IDA & IBRD countries)European UnionFijiFinlandFragile and conflict affected situationsFranceGabonGambia, TheGeorgiaGermanyGhanaGreeceGrenadaGuatemalaGuineaGuinea-BissauGuyanaHaitiHeavily indebted poor countries (HIPC)High incomeHondurasHong Kong SAR, ChinaHungaryIBRD onlyIcelandIDA & IBRD totalIDA blendIDA onlyIDA totalIndiaIndonesiaIran, Islamic Rep.IraqIrelandItalyJamaicaJapanJordanKazakhstanKenyaKiribatiKorea, Rep.KosovoKuwaitKyrgyz RepublicLao PDRLate-demographic dividendLatin America & Caribbean Latin America & Caribbean (excluding high income)Latin America & the Caribbean (IDA & IBRD countries)LatviaLeast developed countries: UN classificationLebanonLesothoLiberiaLithuaniaLow & middle incomeLow incomeLower middle incomeLuxembourgMacedonia, FYRMadagascarMalawiMalaysiaMaldivesMaliMarshall IslandsMauritaniaMauritiusMexicoMicronesia, Fed. Sts.Middle East & North AfricaMiddle East & North Africa (excluding high income)Middle East & North Africa (IDA & IBRD countries)Middle incomeMoldovaMongoliaMontenegroMoroccoMozambiqueMyanmarNamibiaNepalNetherlandsNew ZealandNicaraguaNigerNigeriaNorth AmericaNorwayOECD membersOmanOther small statesPacific island small statesPakistanPalauPanamaPapua New GuineaParaguayPeruPhilippinesPolandPortugalPost-demographic dividendPre-demographic dividendPuerto RicoQatarRomaniaRussian FederationRwandaSamoaSao Tome and PrincipeSaudi ArabiaSenegalSerbiaSeychellesSierra LeoneSingaporeSlovak RepublicSloveniaSmall statesSolomon IslandsSomaliaSouth AfricaSouth AsiaSouth Asia (IDA & IBRD)SpainSri LankaSt. Kitts and NevisSt. LuciaSt. Vincent and the GrenadinesSub-Saharan Africa Sub-Saharan Africa (excluding high income)Sub-Saharan Africa (IDA & IBRD countries)SudanSurinameSwazilandSwedenSwitzerlandSyrian Arab RepublicTajikistanTanzaniaThailandTimor-LesteTogoTongaTrinidad and TobagoTunisiaTurkeyTurkmenistanTuvaluUgandaUkraineUnited Arab EmiratesUnited KingdomUnited StatesUpper middle incomeUruguayUzbekistanVanuatuVenezuela, RBVietnamWest Bank and GazaWorldZambiaZimbabwe Timeline:
This timeline shows a graph from 1979 to 2016 of Grenada. No data until 1978. Number of actual observations by date: 38.
Source name:
World Development Indicators
Source organization:
World Bank national accounts data, and OECD National Accounts data files.
Categories, topics:
Economy & Growth
Last updated:
apr 23, 2017
Indicators value changes by year
Minimum:
-21.357
jan 1, 2007
Maximum:
57.814
jan 1, 2006
At the date of observation
Value
Absolute change
Change from previous value
jan 1, 1979
9.096
+9.096
0.0%
jan 1, 1980
11.405
+2.31
25.39%
jan 1, 1981
-1.31
-12.716
-111.49%
jan 1, 1982
3.465
+4.776
-364.47%
jan 1, 1983
17.595
+14.129
407.72%
jan 1, 1984
-5.826
-23.42
-133.11%
jan 1, 1985
-2.357
+3.469
-59.55%
jan 1, 1986
15.044
+17.401
-738.37%
jan 1, 1987
11.189
-3.855
-25.63%
jan 1, 1988
16.792
+5.604
50.08%
jan 1, 1989
9.558
-7.234
-43.08%
jan 1, 1990
3.92
-5.639
-58.99%
jan 1, 1991
1.738
-2.182
-55.66%
jan 1, 1992
6.997
+5.259
302.54%
jan 1, 1993
2.759
-4.238
-60.57%
jan 1, 1994
-3.277
-6.036
-218.77%
jan 1, 1995
6.448
+9.725
-296.77%
jan 1, 1996
6.047
-0.401
-6.22%
jan 1, 1997
5.364
-0.684
-11.31%
jan 1, 1998
6.8
+1.436
26.78%
jan 1, 1999
14.833
+8.033
118.14%
jan 1, 2000
9.126
-5.707
-38.48%
jan 1, 2001
2.893
-6.233
-68.3%
jan 1, 2002
-8.989
-11.882
-410.71%
jan 1, 2003
2.416
+11.405
-126.88%
jan 1, 2004
13.763
+11.346
469.64%
jan 1, 2005
-0.646
-14.409
-104.7%
jan 1, 2006
57.814
+58.46
-9.05K%
jan 1, 2007
-21.357
-79.171
-136.94%
jan 1, 2008
-1.838
+19.519
-91.39%
jan 1, 2009
-4.39
-2.552
138.86%
jan 1, 2010
-19.312
-14.922
339.92%
jan 1, 2011
-1.124
+18.188
-94.18%
jan 1, 2012
-5.899
-4.775
424.8%
jan 1, 2013
-8.691
-2.791
47.32%
jan 1, 2014
10.824
+19.515
-224.54%
jan 1, 2015
-1.658
-12.482
-115.32%
jan 1, 2016
5.062
+6.72
-405.31%
Ranking of countries by current statistics by years


Comments: