29
/
en
AIzaSyAYiBZKx7MnpbEhh9jyipgxe19OcubqV5w
April 1, 2024
194375
Mauritius
MUS
true
2
1
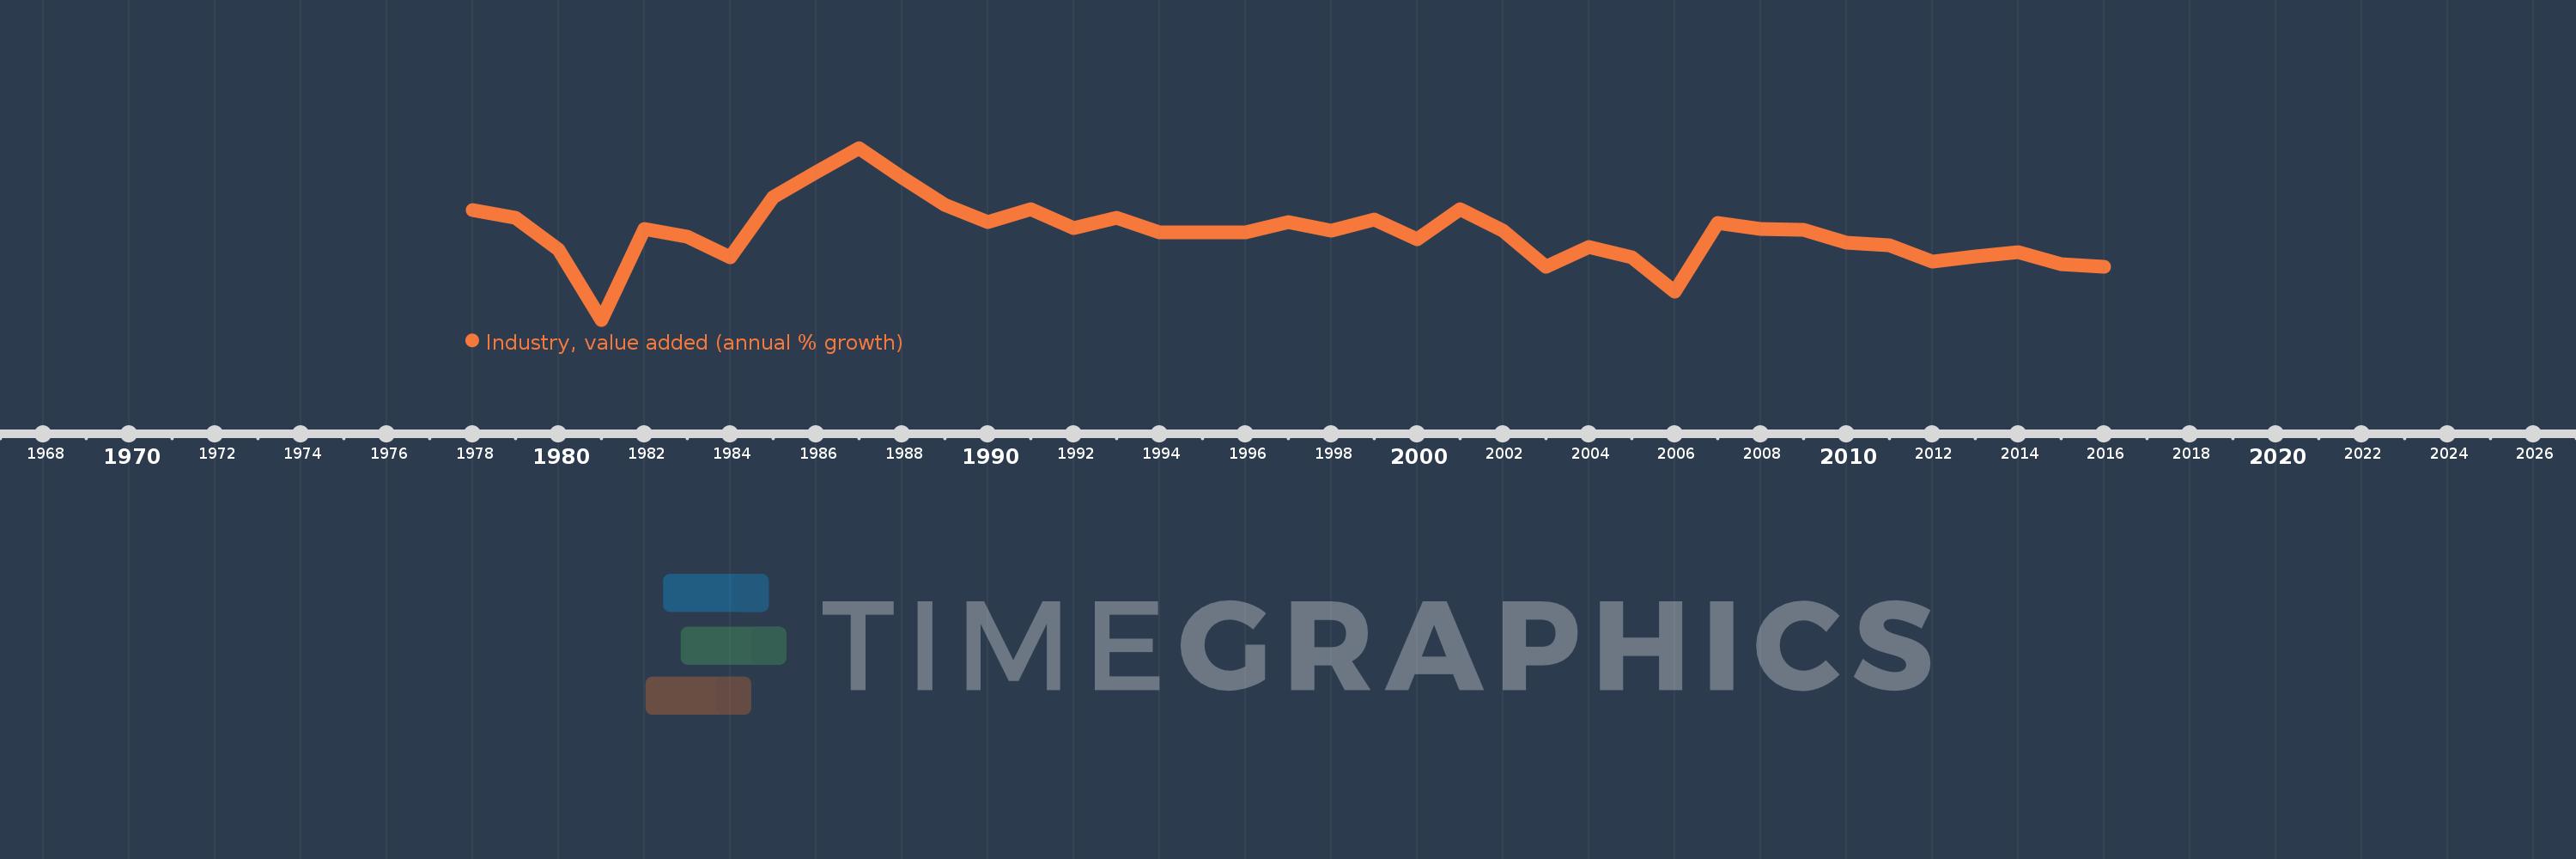
Industry, value added (annual % growth)
2016,2015,2014,2013,2012,2011,2010,2009,2008,2007,2006,2005,2004,2003,2002,2001,2000,1999,1998,1997,1996,1995,1994,1993,1992,1991,1990,1989,1988,1987,1986,1985,1984,1983,1982,1981,1980,1979,1978
This statistics in other country:
AfghanistanAlbaniaAlgeriaAntigua and BarbudaArab WorldArgentinaArmeniaAustraliaAustriaAzerbaijanBahamas, TheBahrainBangladeshBelarusBelgiumBelizeBeninBermudaBhutanBoliviaBosnia and HerzegovinaBotswanaBrazilBrunei DarussalamBulgariaBurkina FasoBurundiCabo VerdeCambodiaCameroonCanadaCaribbean small statesCayman IslandsCentral African RepublicCentral Europe and the BalticsChadChileChinaColombiaComorosCongo, Dem. Rep.Congo, Rep.Costa RicaCote d'IvoireCroatiaCubaCyprusCzech RepublicDenmarkDjiboutiDominicaDominican RepublicEarly-demographic dividendEast Asia & PacificEast Asia & Pacific (excluding high income)East Asia & Pacific (IDA & IBRD countries)EcuadorEgypt, Arab Rep.El SalvadorEquatorial GuineaEritreaEstoniaEthiopiaEuro areaEurope & Central AsiaEurope & Central Asia (excluding high income)Europe & Central Asia (IDA & IBRD countries)European UnionFijiFinlandFragile and conflict affected situationsFranceGabonGambia, TheGeorgiaGermanyGhanaGreeceGrenadaGuatemalaGuineaGuinea-BissauGuyanaHaitiHeavily indebted poor countries (HIPC)High incomeHondurasHong Kong SAR, ChinaHungaryIBRD onlyIcelandIDA & IBRD totalIDA blendIDA onlyIDA totalIndiaIndonesiaIran, Islamic Rep.IraqIrelandItalyJamaicaJapanJordanKazakhstanKenyaKiribatiKorea, Rep.KosovoKuwaitKyrgyz RepublicLao PDRLate-demographic dividendLatin America & Caribbean Latin America & Caribbean (excluding high income)Latin America & the Caribbean (IDA & IBRD countries)LatviaLeast developed countries: UN classificationLebanonLesothoLiberiaLithuaniaLow & middle incomeLow incomeLower middle incomeLuxembourgMacedonia, FYRMadagascarMalawiMalaysiaMaldivesMaliMarshall IslandsMauritaniaMauritiusMexicoMicronesia, Fed. Sts.Middle East & North AfricaMiddle East & North Africa (excluding high income)Middle East & North Africa (IDA & IBRD countries)Middle incomeMoldovaMongoliaMontenegroMoroccoMozambiqueMyanmarNamibiaNepalNetherlandsNew ZealandNicaraguaNigerNigeriaNorth AmericaNorwayOECD membersOmanOther small statesPacific island small statesPakistanPalauPanamaPapua New GuineaParaguayPeruPhilippinesPolandPortugalPost-demographic dividendPre-demographic dividendPuerto RicoQatarRomaniaRussian FederationRwandaSamoaSao Tome and PrincipeSaudi ArabiaSenegalSerbiaSeychellesSierra LeoneSingaporeSlovak RepublicSloveniaSmall statesSolomon IslandsSomaliaSouth AfricaSouth AsiaSouth Asia (IDA & IBRD)SpainSri LankaSt. Kitts and NevisSt. LuciaSt. Vincent and the GrenadinesSub-Saharan Africa Sub-Saharan Africa (excluding high income)Sub-Saharan Africa (IDA & IBRD countries)SudanSurinameSwazilandSwedenSwitzerlandSyrian Arab RepublicTajikistanTanzaniaThailandTimor-LesteTogoTongaTrinidad and TobagoTunisiaTurkeyTurkmenistanTuvaluUgandaUkraineUnited Arab EmiratesUnited KingdomUnited StatesUpper middle incomeUruguayUzbekistanVanuatuVenezuela, RBVietnamWest Bank and GazaWorldZambiaZimbabwe Timeline:
This timeline shows a graph from 1978 to 2016 of Mauritius. No data until 1977. Number of actual observations by date: 39.
Source name:
World Development Indicators
Source organization:
World Bank national accounts data, and OECD National Accounts data files.
Categories, topics:
Economy & Growth
Last updated:
apr 23, 2017
Indicators value changes by year
Minimum:
-9.118
jan 1, 1981
Maximum:
17.922
jan 1, 1987
At the date of observation
Value
Absolute change
Change from previous value
jan 1, 1978
8.158
+8.158
0.0%
jan 1, 1979
6.961
-1.197
-14.68%
jan 1, 1980
1.887
-5.074
-72.89%
jan 1, 1981
-9.118
-11.005
-583.11%
jan 1, 1982
5.219
+14.337
-157.24%
jan 1, 1983
4.016
-1.203
-23.05%
jan 1, 1984
0.678
-3.338
-83.12%
jan 1, 1985
10.11
+9.432
1.39K%
jan 1, 1986
14.066
+3.956
39.13%
jan 1, 1987
17.922
+3.856
27.41%
jan 1, 1988
13.289
-4.632
-25.85%
jan 1, 1989
8.999
-4.29
-32.28%
jan 1, 1990
6.2
-2.799
-31.11%
jan 1, 1991
8.274
+2.074
33.45%
jan 1, 1992
5.242
-3.033
-36.65%
jan 1, 1993
6.975
+1.734
33.07%
jan 1, 1994
4.653
-2.322
-33.29%
jan 1, 1995
4.587
-0.066
-1.42%
jan 1, 1996
4.613
+0.026
0.57%
jan 1, 1997
6.217
+1.604
34.76%
jan 1, 1998
4.922
-1.295
-20.83%
jan 1, 1999
6.649
+1.727
35.09%
jan 1, 2000
3.488
-3.161
-47.53%
jan 1, 2001
8.323
+4.835
138.59%
jan 1, 2002
4.879
-3.444
-41.38%
jan 1, 2003
-0.843
-5.722
-117.27%
jan 1, 2004
2.386
+3.229
-383.14%
jan 1, 2005
0.727
-1.659
-69.51%
jan 1, 2006
-4.682
-5.409
-743.58%
jan 1, 2007
6.159
+10.841
-231.54%
jan 1, 2008
5.179
-0.98
-15.91%
jan 1, 2009
5.07
-0.108
-2.09%
jan 1, 2010
2.997
-2.074
-40.9%
jan 1, 2011
2.64
-0.356
-11.89%
jan 1, 2012
0.0
-2.641
-100.01%
jan 1, 2013
0.831
+0.831
-284.96K%
jan 1, 2014
1.496
+0.665
80.12%
jan 1, 2015
-0.321
-1.817
-121.45%
jan 1, 2016
-0.719
-0.398
124.16%
Ranking of countries by current statistics by years


Comments: