29
/
en
AIzaSyAYiBZKx7MnpbEhh9jyipgxe19OcubqV5w
April 1, 2024
84473
Benin
BEN
true
2
1
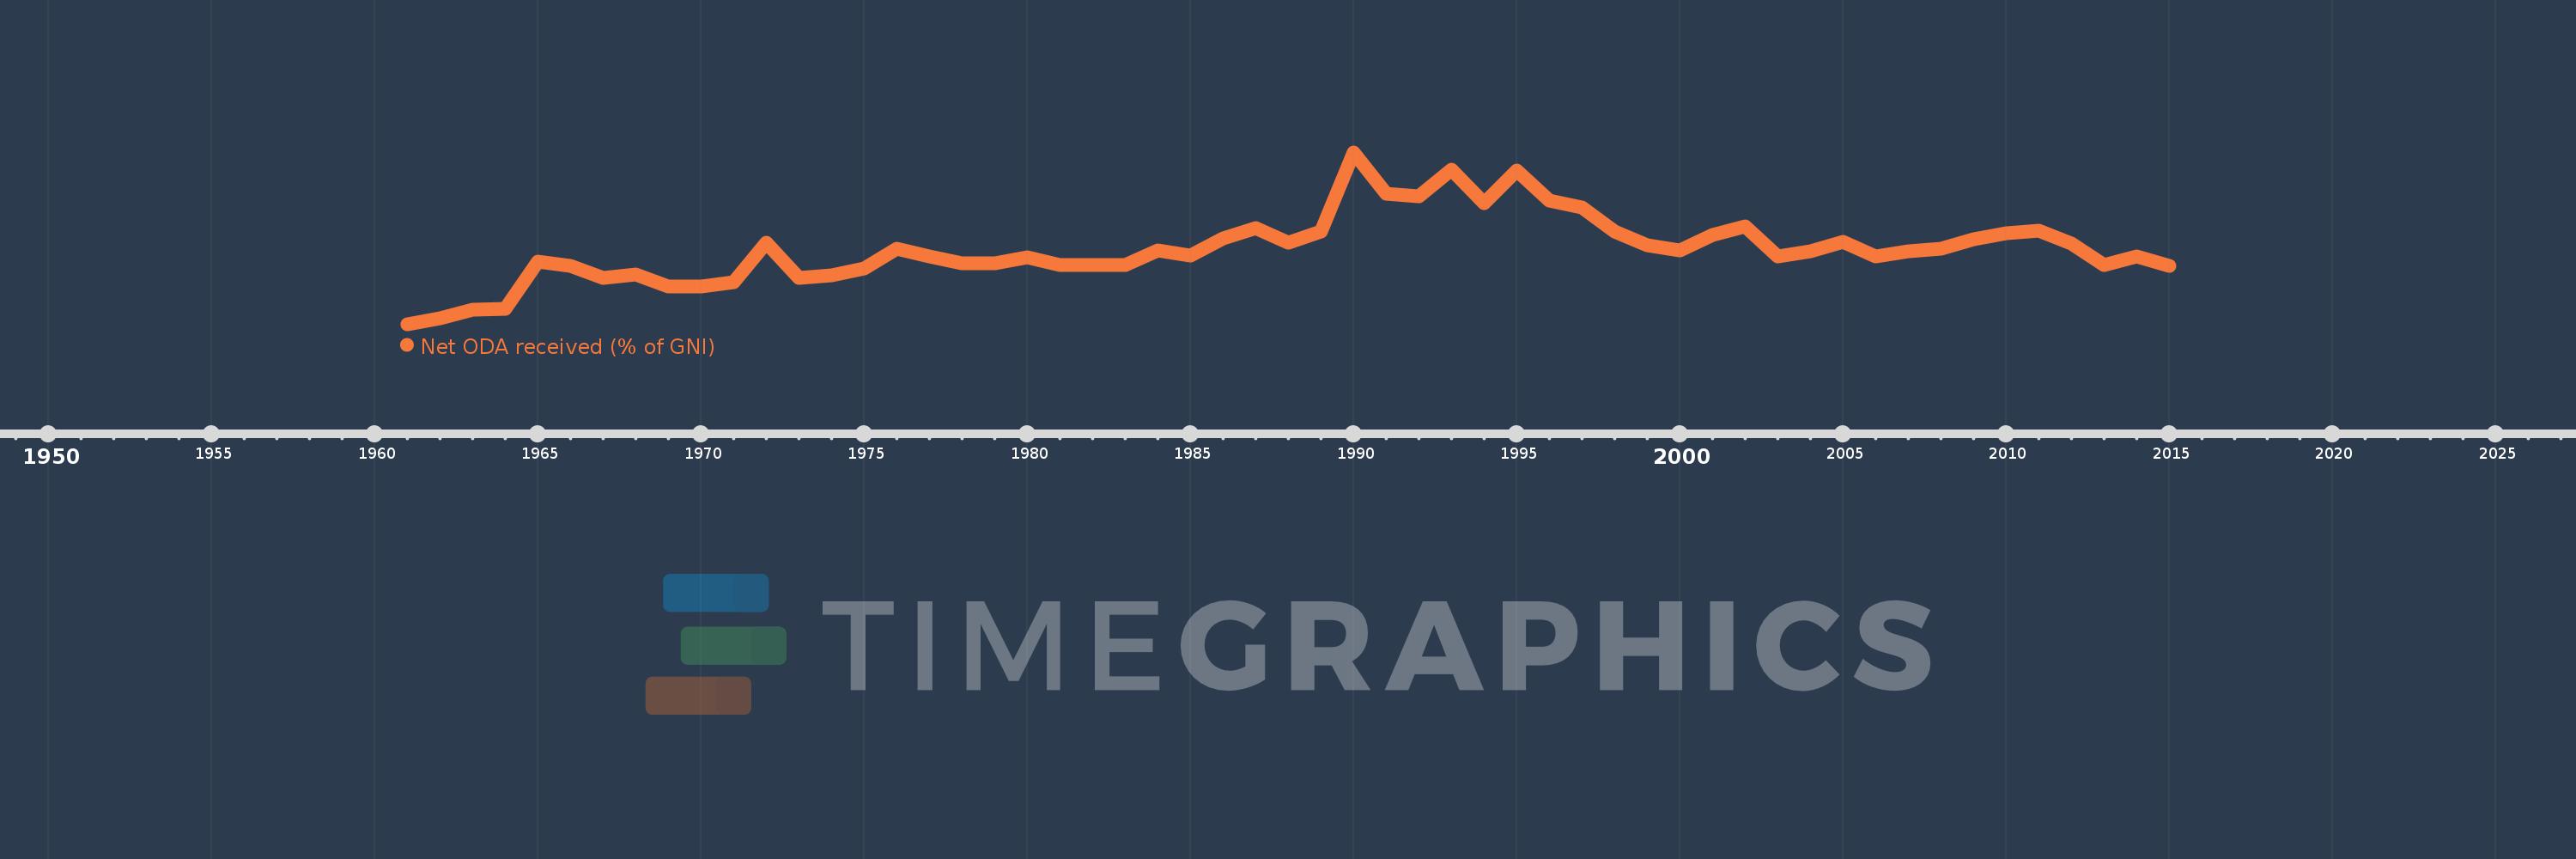
Net ODA received (% of GNI)
2015,2014,2013,2012,2011,2010,2009,2008,2007,2006,2005,2004,2003,2002,2001,2000,1999,1998,1997,1996,1995,1994,1993,1992,1991,1990,1989,1988,1987,1986,1985,1984,1983,1982,1981,1980,1979,1978,1977,1976,1975,1974,1973,1972,1971,1970,1969,1968,1967,1966,1965,1964,1963,1962,1961
This statistics in other country:
AfghanistanAlbaniaAlgeriaAngolaAntigua and BarbudaArab WorldArgentinaArmeniaAzerbaijanBahamas, TheBahrainBangladeshBarbadosBelarusBelizeBeninBermudaBhutanBoliviaBosnia and HerzegovinaBotswanaBrazilBrunei DarussalamBurkina FasoBurundiCabo VerdeCambodiaCameroonCaribbean small statesCentral African RepublicCentral Europe and the BalticsChadChileChinaColombiaComorosCongo, Dem. Rep.Congo, Rep.Costa RicaCote d'IvoireCroatiaCubaCyprusDjiboutiDominicaDominican RepublicEast Asia & PacificEast Asia & Pacific (excluding high income)East Asia & Pacific (IDA & IBRD countries)EcuadorEgypt, Arab Rep.El SalvadorEquatorial GuineaEritreaEthiopiaEuro areaEurope & Central AsiaEurope & Central Asia (excluding high income)Europe & Central Asia (IDA & IBRD countries)European UnionFijiFragile and conflict affected situationsFrench PolynesiaGabonGambia, TheGeorgiaGhanaGrenadaGuatemalaGuineaGuinea-BissauGuyanaHaitiHeavily indebted poor countries (HIPC)High incomeHondurasHong Kong SAR, ChinaIBRD onlyIDA & IBRD totalIDA blendIDA onlyIDA totalIndiaIndonesiaIran, Islamic Rep.IraqIsraelJamaicaJordanKazakhstanKenyaKiribatiKorea, Rep.KosovoKuwaitKyrgyz RepublicLao PDRLatin America & Caribbean Latin America & Caribbean (excluding high income)Latin America & the Caribbean (IDA & IBRD countries)Least developed countries: UN classificationLebanonLesothoLiberiaLibyaLow & middle incomeLow incomeLower middle incomeMacao SAR, ChinaMacedonia, FYRMadagascarMalawiMalaysiaMaldivesMaliMaltaMarshall IslandsMauritaniaMauritiusMexicoMicronesia, Fed. Sts.Middle East & North AfricaMiddle East & North Africa (excluding high income)Middle East & North Africa (IDA & IBRD countries)Middle incomeMoldovaMongoliaMontenegroMoroccoMozambiqueMyanmarNamibiaNauruNepalNew CaledoniaNicaraguaNigerNigeriaNorth AmericaOECD membersOmanOther small statesPacific island small statesPakistanPalauPanamaPapua New GuineaParaguayPeruPhilippinesQatarRwandaSamoaSao Tome and PrincipeSaudi ArabiaSenegalSerbiaSeychellesSierra LeoneSingaporeSloveniaSmall statesSolomon IslandsSomaliaSouth AfricaSouth AsiaSouth Asia (IDA & IBRD)South SudanSri LankaSt. Kitts and NevisSt. LuciaSt. Vincent and the GrenadinesSub-Saharan Africa Sub-Saharan Africa (excluding high income)Sub-Saharan Africa (IDA & IBRD countries)SudanSurinameSwazilandSyrian Arab RepublicTajikistanTanzaniaThailandTimor-LesteTogoTongaTrinidad and TobagoTunisiaTurkeyTurkmenistanTuvaluUgandaUkraineUpper middle incomeUruguayUzbekistanVanuatuVenezuela, RBVietnamWest Bank and GazaWorldYemen, Rep.ZambiaZimbabwe Timeline:
This timeline shows a graph from 1961 to 2015 of Benin. No data until 1960. Number of actual observations by date: 55.
Source name:
World Development Indicators
Source organization:
Development Assistance Committee of the Organisation for Economic Co-operation and Development, Geographical Distribution of Financial Flows to Developing Countries, Development Co-operation Report, and International Development Statistics database. Data are available online at: www.oecd.org/dac/stats/idsonline. World Bank GNI estimates are used for the denominator.
Categories, topics:
Aid Effectiveness, Economy & Growth, External Debt
Last updated:
apr 23, 2017
Indicators value changes by year
Maximum:
18.295
jan 1, 1990
At the date of observation
Value
Absolute change
Change from previous value
jan 1, 1961
0.009
+0.009
0.0%
jan 1, 1962
0.63
+0.621
7.0K%
jan 1, 1963
1.591
+0.961
152.56%
jan 1, 1964
1.683
+0.092
5.76%
jan 1, 1965
6.716
+5.034
299.16%
jan 1, 1966
6.185
-0.532
-7.92%
jan 1, 1967
4.927
-1.258
-20.33%
jan 1, 1968
5.32
+0.393
7.98%
jan 1, 1969
4.044
-1.276
-23.99%
jan 1, 1970
4.003
-0.041
-1.01%
jan 1, 1971
4.451
+0.448
11.2%
jan 1, 1972
8.73
+4.278
96.11%
jan 1, 1973
4.909
-3.821
-43.77%
jan 1, 1974
5.25
+0.341
6.95%
jan 1, 1975
5.938
+0.688
13.1%
jan 1, 1976
8.01
+2.072
34.89%
jan 1, 1977
7.267
-0.743
-9.28%
jan 1, 1978
6.511
-0.756
-10.4%
jan 1, 1979
6.494
-0.016
-0.25%
jan 1, 1980
7.125
+0.631
9.72%
jan 1, 1981
6.292
-0.834
-11.7%
jan 1, 1982
6.308
+0.016
0.26%
jan 1, 1983
6.316
+0.009
0.14%
jan 1, 1984
7.849
+1.533
24.26%
jan 1, 1985
7.345
-0.504
-6.42%
jan 1, 1986
9.167
+1.822
24.81%
jan 1, 1987
10.279
+1.112
12.13%
jan 1, 1988
8.717
-1.563
-15.2%
jan 1, 1989
9.901
+1.184
13.59%
jan 1, 1990
18.295
+8.394
84.78%
jan 1, 1991
13.893
-4.403
-24.07%
jan 1, 1992
13.585
-0.308
-2.22%
jan 1, 1993
16.456
+2.872
21.14%
jan 1, 1994
12.854
-3.602
-21.89%
jan 1, 1995
16.372
+3.517
27.36%
jan 1, 1996
13.177
-3.195
-19.51%
jan 1, 1997
12.431
-0.746
-5.66%
jan 1, 1998
9.857
-2.574
-20.71%
jan 1, 1999
8.402
-1.455
-14.76%
jan 1, 2000
7.876
-0.526
-6.26%
jan 1, 2001
9.521
+1.645
20.89%
jan 1, 2002
10.425
+0.904
9.49%
jan 1, 2003
7.238
-3.187
-30.57%
jan 1, 2004
7.753
+0.515
7.12%
jan 1, 2005
8.782
+1.029
13.27%
jan 1, 2006
7.249
-1.533
-17.45%
jan 1, 2007
7.811
+0.562
7.76%
jan 1, 2008
8.012
+0.2
2.57%
jan 1, 2009
9.008
+0.996
12.43%
jan 1, 2010
9.655
+0.647
7.19%
jan 1, 2011
9.982
+0.327
3.39%
jan 1, 2012
8.626
-1.356
-13.59%
jan 1, 2013
6.294
-2.332
-27.04%
jan 1, 2014
7.262
+0.968
15.38%
jan 1, 2015
6.225
-1.037
-14.28%
Ranking of countries by current statistics by years


Comments: