29
/
en
AIzaSyAYiBZKx7MnpbEhh9jyipgxe19OcubqV5w
April 1, 2024
60100
Sub-Saharan Africa (excluding high income)
SSA
false
2
1
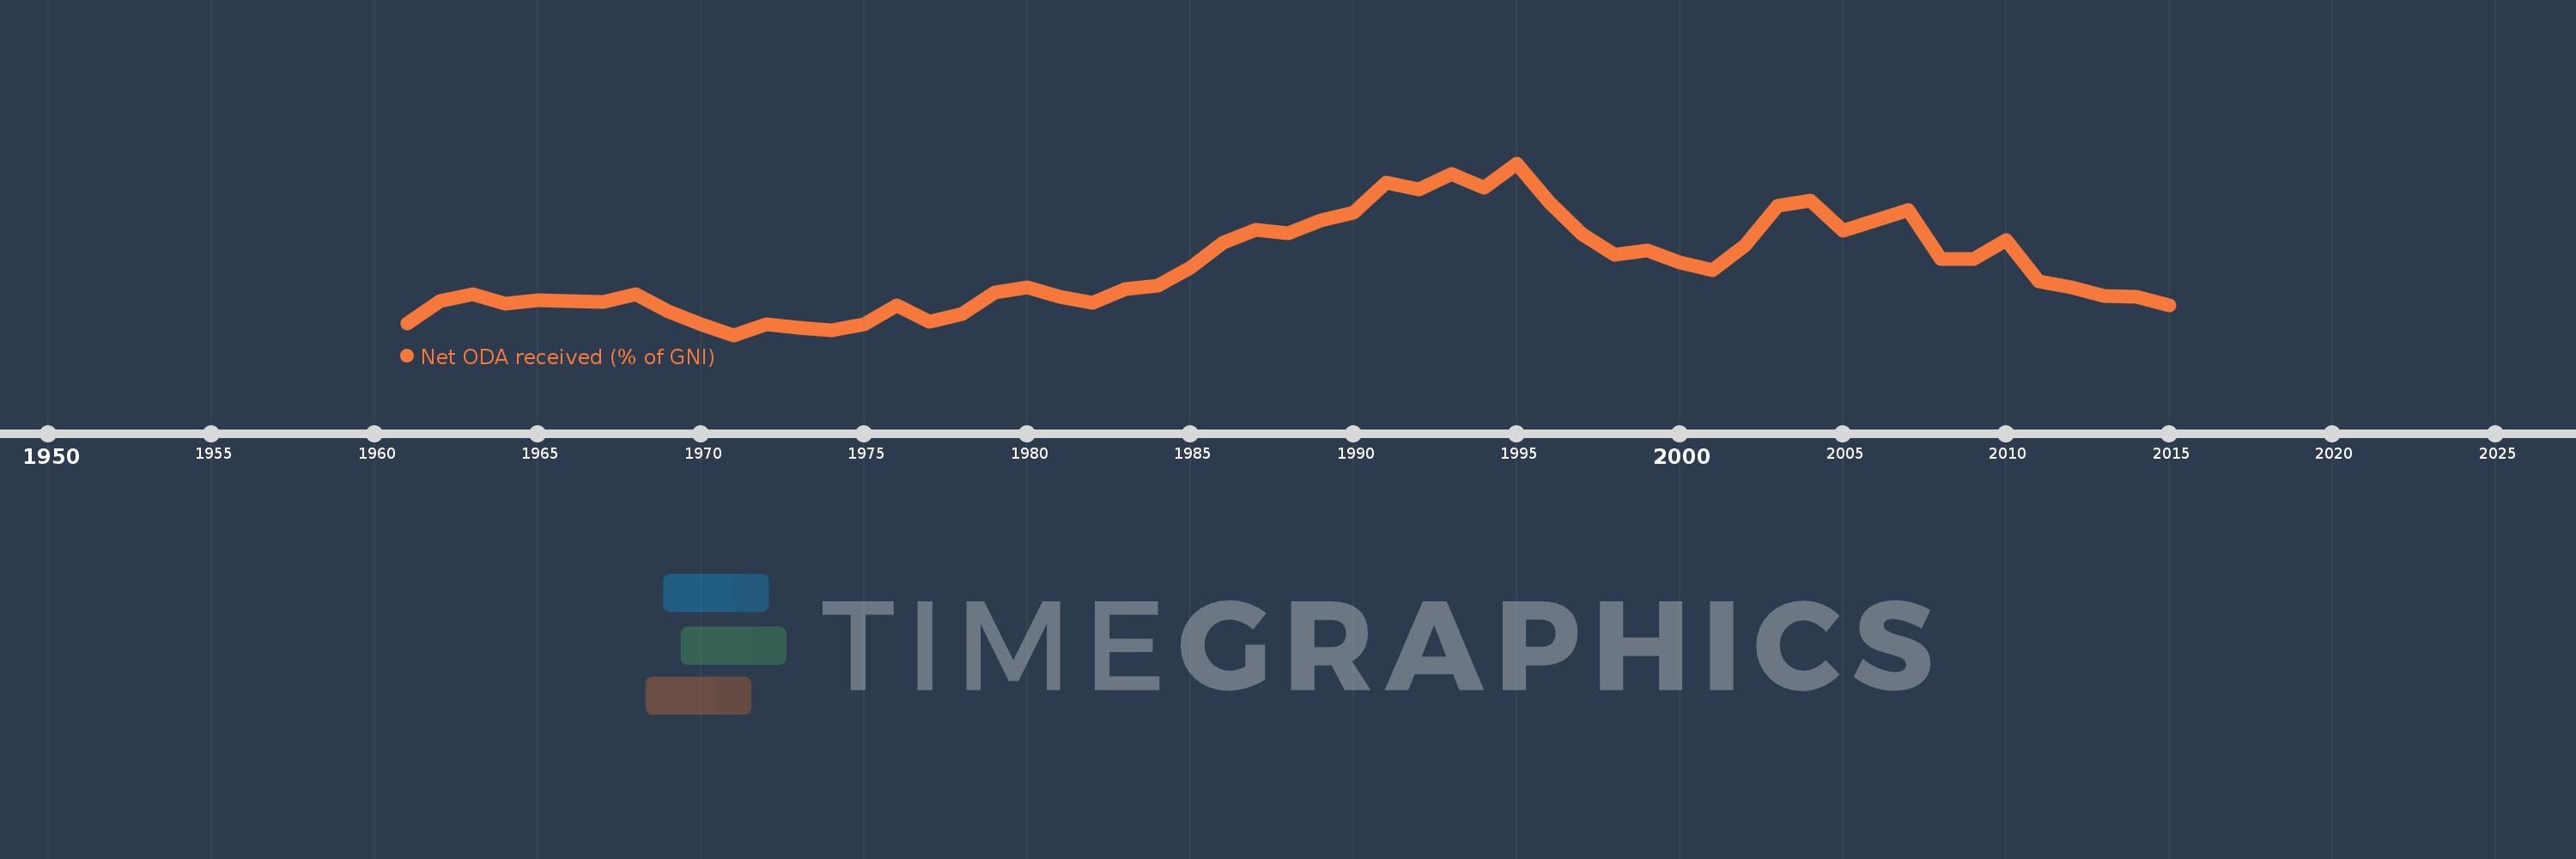
Net ODA received (% of GNI)
2015,2014,2013,2012,2011,2010,2009,2008,2007,2006,2005,2004,2003,2002,2001,2000,1999,1998,1997,1996,1995,1994,1993,1992,1991,1990,1989,1988,1987,1986,1985,1984,1983,1982,1981,1980,1979,1978,1977,1976,1975,1974,1973,1972,1971,1970,1969,1968,1967,1966,1965,1964,1963,1962,1961
This statistics in other country:
AfghanistanAlbaniaAlgeriaAngolaAntigua and BarbudaArab WorldArgentinaArmeniaAzerbaijanBahamas, TheBahrainBangladeshBarbadosBelarusBelizeBeninBermudaBhutanBoliviaBosnia and HerzegovinaBotswanaBrazilBrunei DarussalamBurkina FasoBurundiCabo VerdeCambodiaCameroonCaribbean small statesCentral African RepublicCentral Europe and the BalticsChadChileChinaColombiaComorosCongo, Dem. Rep.Congo, Rep.Costa RicaCote d'IvoireCroatiaCubaCyprusDjiboutiDominicaDominican RepublicEast Asia & PacificEast Asia & Pacific (excluding high income)East Asia & Pacific (IDA & IBRD countries)EcuadorEgypt, Arab Rep.El SalvadorEquatorial GuineaEritreaEthiopiaEuro areaEurope & Central AsiaEurope & Central Asia (excluding high income)Europe & Central Asia (IDA & IBRD countries)European UnionFijiFragile and conflict affected situationsFrench PolynesiaGabonGambia, TheGeorgiaGhanaGrenadaGuatemalaGuineaGuinea-BissauGuyanaHaitiHeavily indebted poor countries (HIPC)High incomeHondurasHong Kong SAR, ChinaIBRD onlyIDA & IBRD totalIDA blendIDA onlyIDA totalIndiaIndonesiaIran, Islamic Rep.IraqIsraelJamaicaJordanKazakhstanKenyaKiribatiKorea, Rep.KosovoKuwaitKyrgyz RepublicLao PDRLatin America & Caribbean Latin America & Caribbean (excluding high income)Latin America & the Caribbean (IDA & IBRD countries)Least developed countries: UN classificationLebanonLesothoLiberiaLibyaLow & middle incomeLow incomeLower middle incomeMacao SAR, ChinaMacedonia, FYRMadagascarMalawiMalaysiaMaldivesMaliMaltaMarshall IslandsMauritaniaMauritiusMexicoMicronesia, Fed. Sts.Middle East & North AfricaMiddle East & North Africa (excluding high income)Middle East & North Africa (IDA & IBRD countries)Middle incomeMoldovaMongoliaMontenegroMoroccoMozambiqueMyanmarNamibiaNauruNepalNew CaledoniaNicaraguaNigerNigeriaNorth AmericaOECD membersOmanOther small statesPacific island small statesPakistanPalauPanamaPapua New GuineaParaguayPeruPhilippinesQatarRwandaSamoaSao Tome and PrincipeSaudi ArabiaSenegalSerbiaSeychellesSierra LeoneSingaporeSloveniaSmall statesSolomon IslandsSomaliaSouth AfricaSouth AsiaSouth Asia (IDA & IBRD)South SudanSri LankaSt. Kitts and NevisSt. LuciaSt. Vincent and the GrenadinesSub-Saharan Africa Sub-Saharan Africa (excluding high income)Sub-Saharan Africa (IDA & IBRD countries)SudanSurinameSwazilandSyrian Arab RepublicTajikistanTanzaniaThailandTimor-LesteTogoTongaTrinidad and TobagoTunisiaTurkeyTurkmenistanTuvaluUgandaUkraineUpper middle incomeUruguayUzbekistanVanuatuVenezuela, RBVietnamWest Bank and GazaWorldYemen, Rep.ZambiaZimbabwe Timeline:
This timeline shows a graph from 1961 to 2015 of Sub-Saharan Africa (excluding high income). No data until 1960. Number of actual observations by date: 55.
Source name:
World Development Indicators
Source organization:
Development Assistance Committee of the Organisation for Economic Co-operation and Development, Geographical Distribution of Financial Flows to Developing Countries, Development Co-operation Report, and International Development Statistics database. Data are available online at: www.oecd.org/dac/stats/idsonline. World Bank GNI estimates are used for the denominator.
Categories, topics:
Aid Effectiveness, Economy & Growth, External Debt
Last updated:
apr 23, 2017
Indicators value changes by year
At the date of observation
Value
Absolute change
Change from previous value
jan 1, 1961
2.26
+2.26
0.0%
jan 1, 1962
2.867
+0.607
26.85%
jan 1, 1963
3.06
+0.192
6.71%
jan 1, 1964
2.815
-0.245
-8.01%
jan 1, 1965
2.898
+0.083
2.96%
jan 1, 1966
2.868
-0.03
-1.05%
jan 1, 1967
2.85
-0.018
-0.62%
jan 1, 1968
3.073
+0.224
7.84%
jan 1, 1969
2.604
-0.47
-15.28%
jan 1, 1970
2.248
-0.356
-13.68%
jan 1, 1971
1.943
-0.305
-13.55%
jan 1, 1972
2.243
+0.3
15.44%
jan 1, 1973
2.133
-0.11
-4.9%
jan 1, 1974
2.079
-0.055
-2.56%
jan 1, 1975
2.242
+0.163
7.85%
jan 1, 1976
2.749
+0.507
22.61%
jan 1, 1977
2.305
-0.443
-16.12%
jan 1, 1978
2.519
+0.213
9.25%
jan 1, 1979
3.116
+0.597
23.7%
jan 1, 1980
3.248
+0.132
4.25%
jan 1, 1981
2.989
-0.259
-7.97%
jan 1, 1982
2.833
-0.157
-5.24%
jan 1, 1983
3.201
+0.368
13.01%
jan 1, 1984
3.306
+0.105
3.27%
jan 1, 1985
3.79
+0.485
14.66%
jan 1, 1986
4.479
+0.688
18.16%
jan 1, 1987
4.846
+0.367
8.2%
jan 1, 1988
4.75
-0.096
-1.99%
jan 1, 1989
5.103
+0.353
7.43%
jan 1, 1990
5.318
+0.215
4.21%
jan 1, 1991
6.14
+0.823
15.47%
jan 1, 1992
5.951
-0.189
-3.08%
jan 1, 1993
6.362
+0.411
6.91%
jan 1, 1994
6.003
-0.359
-5.65%
jan 1, 1995
6.669
+0.666
11.09%
jan 1, 1996
5.584
-1.085
-16.26%
jan 1, 1997
4.721
-0.863
-15.45%
jan 1, 1998
4.143
-0.579
-12.26%
jan 1, 1999
4.268
+0.126
3.03%
jan 1, 2000
3.932
-0.336
-7.88%
jan 1, 2001
3.725
-0.207
-5.26%
jan 1, 2002
4.404
+0.679
18.23%
jan 1, 2003
5.495
+1.091
24.78%
jan 1, 2004
5.639
+0.144
2.61%
jan 1, 2005
4.821
-0.818
-14.51%
jan 1, 2006
5.092
+0.271
5.62%
jan 1, 2007
5.379
+0.287
5.65%
jan 1, 2008
4.042
-1.338
-24.87%
jan 1, 2009
4.031
-0.011
-0.27%
jan 1, 2010
4.548
+0.517
12.84%
jan 1, 2011
3.412
-1.137
-24.99%
jan 1, 2012
3.245
-0.167
-4.88%
jan 1, 2013
3.009
-0.236
-7.28%
jan 1, 2014
2.997
-0.012
-0.39%
jan 1, 2015
2.749
-0.248
-8.28%
Ranking of countries by current statistics by years


Comments: