29
/
en
AIzaSyAYiBZKx7MnpbEhh9jyipgxe19OcubqV5w
April 1, 2024
162948
Jamaica
JAM
true
2
1
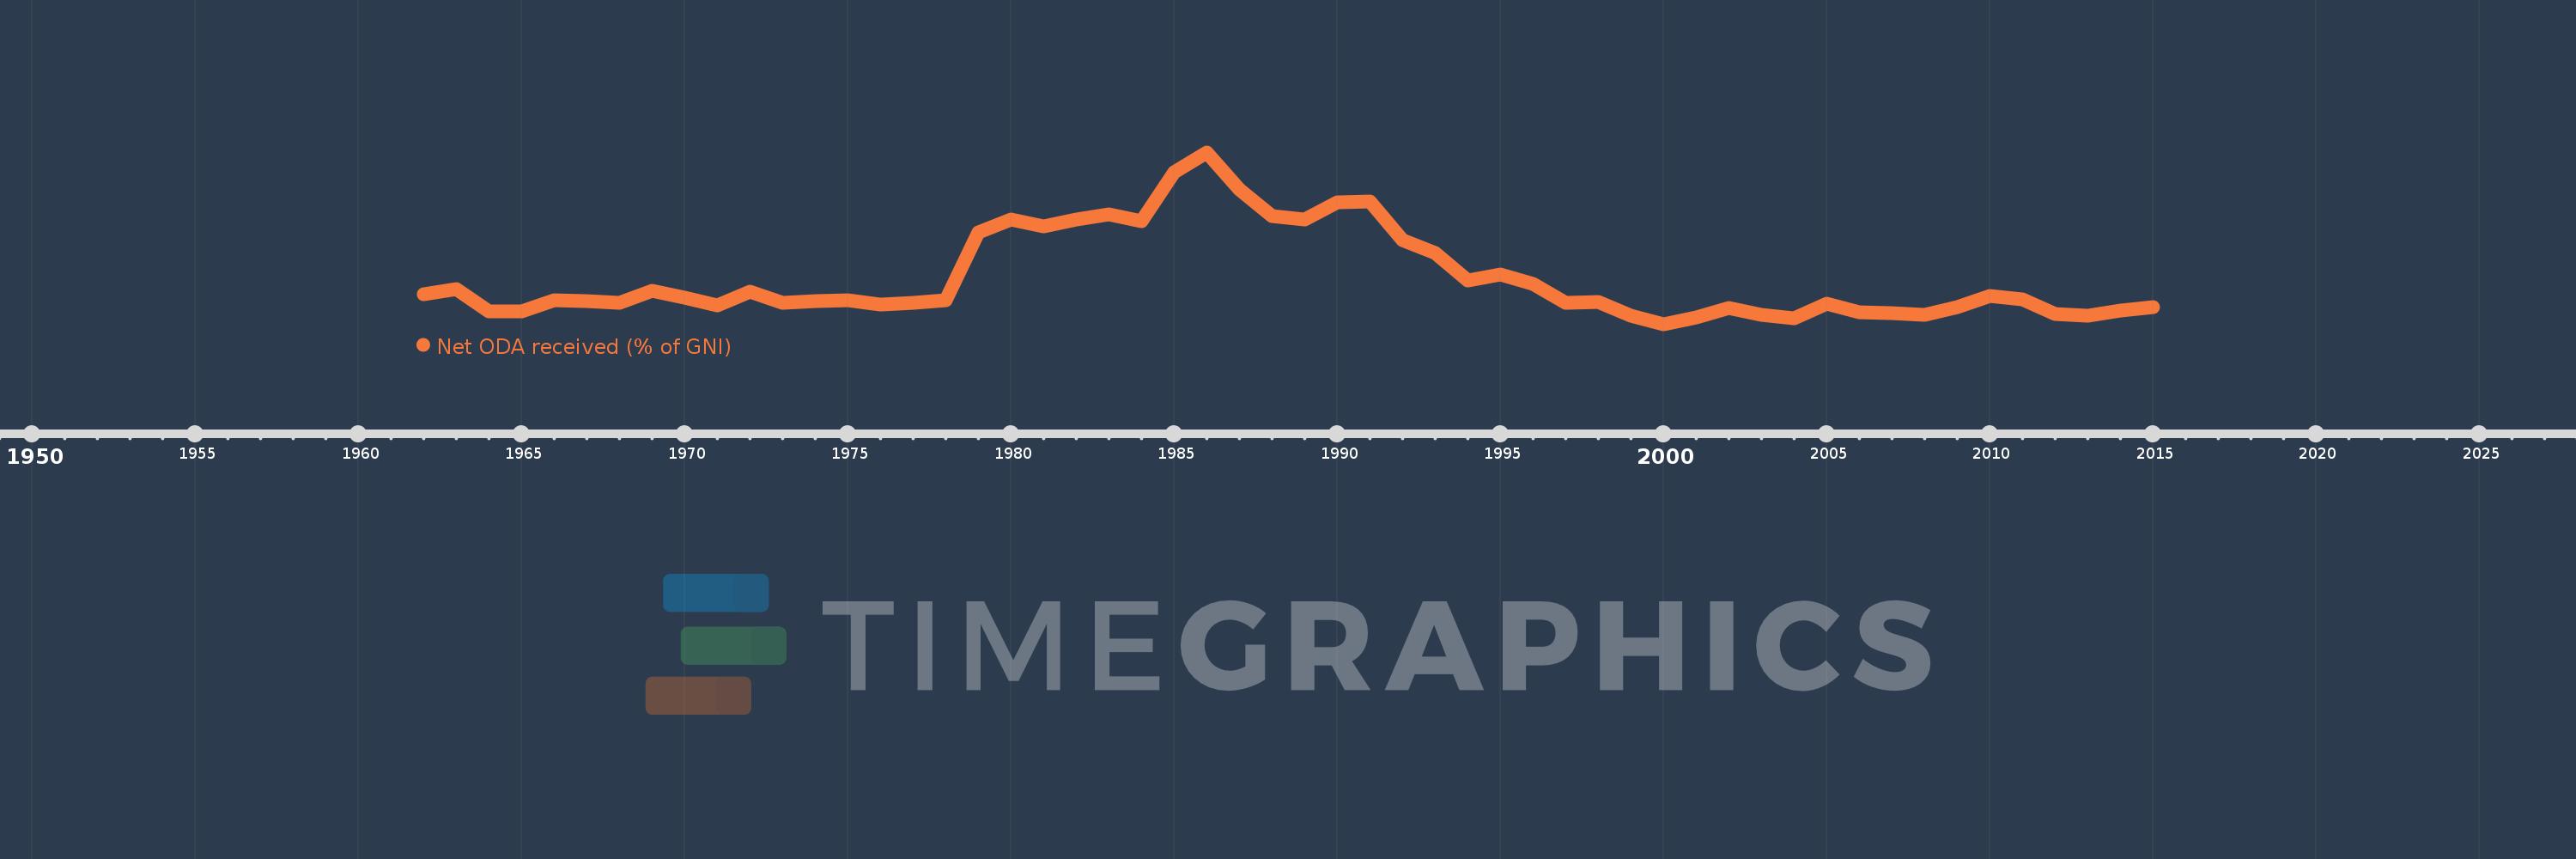
Net ODA received (% of GNI)
2015,2014,2013,2012,2011,2010,2009,2008,2007,2006,2005,2004,2003,2002,2001,2000,1999,1998,1997,1996,1995,1994,1993,1992,1991,1990,1989,1988,1987,1986,1985,1984,1983,1982,1981,1980,1979,1978,1977,1976,1975,1974,1973,1972,1971,1970,1969,1968,1967,1966,1965,1964,1963,1962
This statistics in other country:
AfghanistanAlbaniaAlgeriaAngolaAntigua and BarbudaArab WorldArgentinaArmeniaAzerbaijanBahamas, TheBahrainBangladeshBarbadosBelarusBelizeBeninBermudaBhutanBoliviaBosnia and HerzegovinaBotswanaBrazilBrunei DarussalamBurkina FasoBurundiCabo VerdeCambodiaCameroonCaribbean small statesCentral African RepublicCentral Europe and the BalticsChadChileChinaColombiaComorosCongo, Dem. Rep.Congo, Rep.Costa RicaCote d'IvoireCroatiaCubaCyprusDjiboutiDominicaDominican RepublicEast Asia & PacificEast Asia & Pacific (excluding high income)East Asia & Pacific (IDA & IBRD countries)EcuadorEgypt, Arab Rep.El SalvadorEquatorial GuineaEritreaEthiopiaEuro areaEurope & Central AsiaEurope & Central Asia (excluding high income)Europe & Central Asia (IDA & IBRD countries)European UnionFijiFragile and conflict affected situationsFrench PolynesiaGabonGambia, TheGeorgiaGhanaGrenadaGuatemalaGuineaGuinea-BissauGuyanaHaitiHeavily indebted poor countries (HIPC)High incomeHondurasHong Kong SAR, ChinaIBRD onlyIDA & IBRD totalIDA blendIDA onlyIDA totalIndiaIndonesiaIran, Islamic Rep.IraqIsraelJamaicaJordanKazakhstanKenyaKiribatiKorea, Rep.KosovoKuwaitKyrgyz RepublicLao PDRLatin America & Caribbean Latin America & Caribbean (excluding high income)Latin America & the Caribbean (IDA & IBRD countries)Least developed countries: UN classificationLebanonLesothoLiberiaLibyaLow & middle incomeLow incomeLower middle incomeMacao SAR, ChinaMacedonia, FYRMadagascarMalawiMalaysiaMaldivesMaliMaltaMarshall IslandsMauritaniaMauritiusMexicoMicronesia, Fed. Sts.Middle East & North AfricaMiddle East & North Africa (excluding high income)Middle East & North Africa (IDA & IBRD countries)Middle incomeMoldovaMongoliaMontenegroMoroccoMozambiqueMyanmarNamibiaNauruNepalNew CaledoniaNicaraguaNigerNigeriaNorth AmericaOECD membersOmanOther small statesPacific island small statesPakistanPalauPanamaPapua New GuineaParaguayPeruPhilippinesQatarRwandaSamoaSao Tome and PrincipeSaudi ArabiaSenegalSerbiaSeychellesSierra LeoneSingaporeSloveniaSmall statesSolomon IslandsSomaliaSouth AfricaSouth AsiaSouth Asia (IDA & IBRD)South SudanSri LankaSt. Kitts and NevisSt. LuciaSt. Vincent and the GrenadinesSub-Saharan Africa Sub-Saharan Africa (excluding high income)Sub-Saharan Africa (IDA & IBRD countries)SudanSurinameSwazilandSyrian Arab RepublicTajikistanTanzaniaThailandTimor-LesteTogoTongaTrinidad and TobagoTunisiaTurkeyTurkmenistanTuvaluUgandaUkraineUpper middle incomeUruguayUzbekistanVanuatuVenezuela, RBVietnamWest Bank and GazaWorldYemen, Rep.ZambiaZimbabwe Timeline:
This timeline shows a graph from 1962 to 2015 of Jamaica. No data until 1961. Number of actual observations by date: 54.
Source name:
World Development Indicators
Source organization:
Development Assistance Committee of the Organisation for Economic Co-operation and Development, Geographical Distribution of Financial Flows to Developing Countries, Development Co-operation Report, and International Development Statistics database. Data are available online at: www.oecd.org/dac/stats/idsonline. World Bank GNI estimates are used for the denominator.
Categories, topics:
Aid Effectiveness, Economy & Growth, External Debt
Last updated:
apr 23, 2017
Indicators value changes by year
Minimum:
-0.265
jan 1, 2000
At the date of observation
Value
Absolute change
Change from previous value
jan 1, 1962
1.384
+1.384
0.0%
jan 1, 1963
1.693
+0.309
22.32%
jan 1, 1964
0.427
-1.266
-74.78%
jan 1, 1965
0.456
+0.029
6.88%
jan 1, 1966
1.039
+0.583
127.77%
jan 1, 1967
0.999
-0.04
-3.85%
jan 1, 1968
0.911
-0.089
-8.88%
jan 1, 1969
1.566
+0.656
72.01%
jan 1, 1970
1.174
-0.392
-25.02%
jan 1, 1971
0.781
-0.393
-33.47%
jan 1, 1972
1.528
+0.747
95.58%
jan 1, 1973
0.92
-0.608
-39.8%
jan 1, 1974
1.009
+0.089
9.64%
jan 1, 1975
1.063
+0.055
5.41%
jan 1, 1976
0.837
-0.227
-21.33%
jan 1, 1977
0.894
+0.058
6.89%
jan 1, 1978
1.051
+0.156
17.5%
jan 1, 1979
4.803
+3.752
357.15%
jan 1, 1980
5.502
+0.699
14.56%
jan 1, 1981
5.111
-0.391
-7.1%
jan 1, 1982
5.498
+0.387
7.57%
jan 1, 1983
5.784
+0.286
5.2%
jan 1, 1984
5.425
-0.359
-6.21%
jan 1, 1985
8.124
+2.699
49.75%
jan 1, 1986
9.199
+1.075
13.23%
jan 1, 1987
7.145
-2.054
-22.33%
jan 1, 1988
5.681
-1.464
-20.49%
jan 1, 1989
5.511
-0.17
-2.99%
jan 1, 1990
6.453
+0.942
17.1%
jan 1, 1991
6.509
+0.056
0.87%
jan 1, 1992
4.361
-2.148
-33.0%
jan 1, 1993
3.658
-0.703
-16.12%
jan 1, 1994
2.134
-1.524
-41.66%
jan 1, 1995
2.454
+0.32
14.98%
jan 1, 1996
1.946
-0.508
-20.7%
jan 1, 1997
0.906
-1.04
-53.44%
jan 1, 1998
0.973
+0.067
7.4%
jan 1, 1999
0.221
-0.752
-77.33%
jan 1, 2000
-0.265
-0.486
-220.33%
jan 1, 2001
0.1
+0.365
-137.55%
jan 1, 2002
0.625
+0.525
527.01%
jan 1, 2003
0.264
-0.361
-57.72%
jan 1, 2004
0.074
-0.191
-72.1%
jan 1, 2005
0.863
+0.79
1.07K%
jan 1, 2006
0.376
-0.487
-56.46%
jan 1, 2007
0.329
-0.047
-12.4%
jan 1, 2008
0.231
-0.098
-29.9%
jan 1, 2009
0.655
+0.424
183.5%
jan 1, 2010
1.313
+0.658
100.6%
jan 1, 2011
1.11
-0.203
-15.49%
jan 1, 2012
0.279
-0.831
-74.87%
jan 1, 2013
0.181
-0.098
-35.02%
jan 1, 2014
0.501
+0.32
176.36%
jan 1, 2015
0.678
+0.177
35.39%
Ranking of countries by current statistics by years


Comments: