29
/
en
AIzaSyAYiBZKx7MnpbEhh9jyipgxe19OcubqV5w
April 1, 2024
168860
Kiribati
KIR
true
2
1
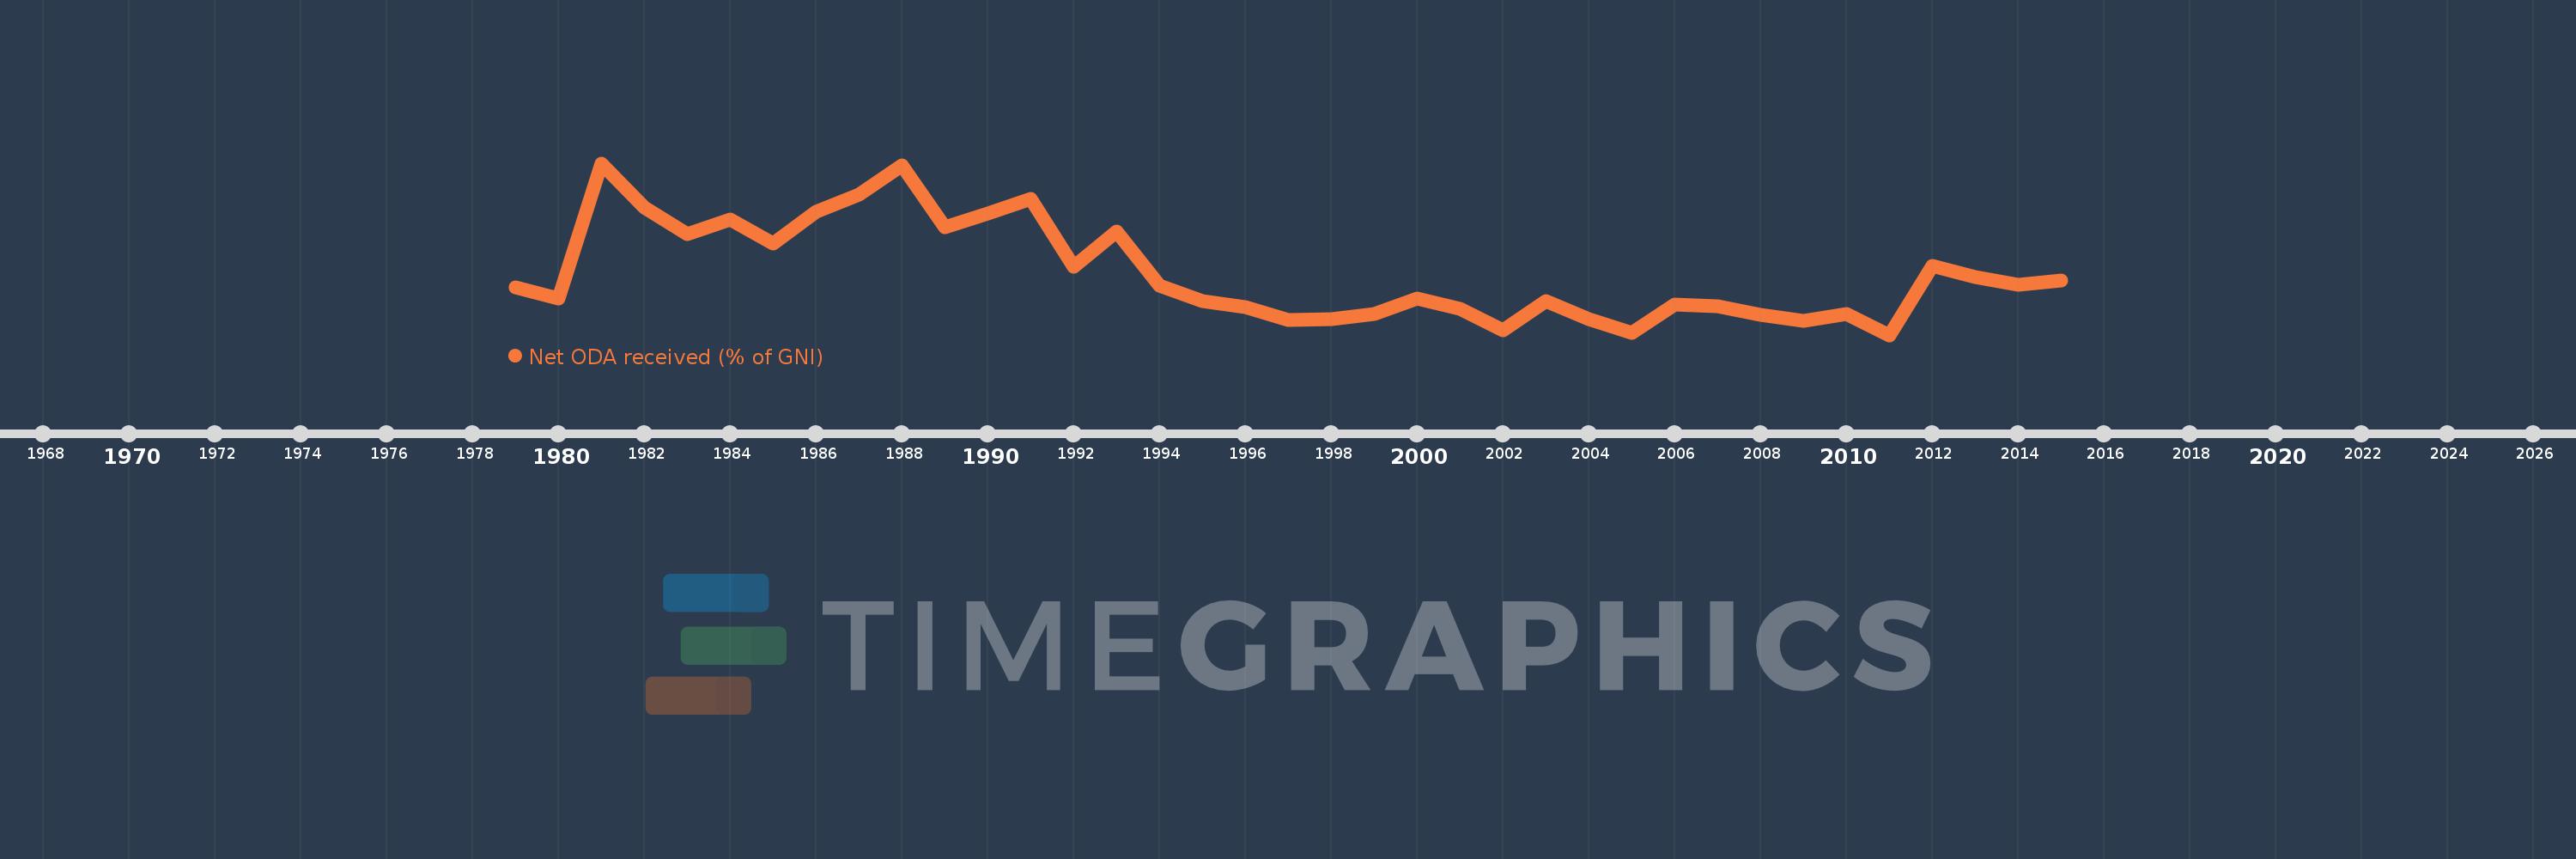
Net ODA received (% of GNI)
2015,2014,2013,2012,2011,2010,2009,2008,2007,2006,2005,2004,2003,2002,2001,2000,1999,1998,1997,1996,1995,1994,1993,1992,1991,1990,1989,1988,1987,1986,1985,1984,1983,1982,1981,1980,1979
This statistics in other country:
AfghanistanAlbaniaAlgeriaAngolaAntigua and BarbudaArab WorldArgentinaArmeniaAzerbaijanBahamas, TheBahrainBangladeshBarbadosBelarusBelizeBeninBermudaBhutanBoliviaBosnia and HerzegovinaBotswanaBrazilBrunei DarussalamBurkina FasoBurundiCabo VerdeCambodiaCameroonCaribbean small statesCentral African RepublicCentral Europe and the BalticsChadChileChinaColombiaComorosCongo, Dem. Rep.Congo, Rep.Costa RicaCote d'IvoireCroatiaCubaCyprusDjiboutiDominicaDominican RepublicEast Asia & PacificEast Asia & Pacific (excluding high income)East Asia & Pacific (IDA & IBRD countries)EcuadorEgypt, Arab Rep.El SalvadorEquatorial GuineaEritreaEthiopiaEuro areaEurope & Central AsiaEurope & Central Asia (excluding high income)Europe & Central Asia (IDA & IBRD countries)European UnionFijiFragile and conflict affected situationsFrench PolynesiaGabonGambia, TheGeorgiaGhanaGrenadaGuatemalaGuineaGuinea-BissauGuyanaHaitiHeavily indebted poor countries (HIPC)High incomeHondurasHong Kong SAR, ChinaIBRD onlyIDA & IBRD totalIDA blendIDA onlyIDA totalIndiaIndonesiaIran, Islamic Rep.IraqIsraelJamaicaJordanKazakhstanKenyaKiribatiKorea, Rep.KosovoKuwaitKyrgyz RepublicLao PDRLatin America & Caribbean Latin America & Caribbean (excluding high income)Latin America & the Caribbean (IDA & IBRD countries)Least developed countries: UN classificationLebanonLesothoLiberiaLibyaLow & middle incomeLow incomeLower middle incomeMacao SAR, ChinaMacedonia, FYRMadagascarMalawiMalaysiaMaldivesMaliMaltaMarshall IslandsMauritaniaMauritiusMexicoMicronesia, Fed. Sts.Middle East & North AfricaMiddle East & North Africa (excluding high income)Middle East & North Africa (IDA & IBRD countries)Middle incomeMoldovaMongoliaMontenegroMoroccoMozambiqueMyanmarNamibiaNauruNepalNew CaledoniaNicaraguaNigerNigeriaNorth AmericaOECD membersOmanOther small statesPacific island small statesPakistanPalauPanamaPapua New GuineaParaguayPeruPhilippinesQatarRwandaSamoaSao Tome and PrincipeSaudi ArabiaSenegalSerbiaSeychellesSierra LeoneSingaporeSloveniaSmall statesSolomon IslandsSomaliaSouth AfricaSouth AsiaSouth Asia (IDA & IBRD)South SudanSri LankaSt. Kitts and NevisSt. LuciaSt. Vincent and the GrenadinesSub-Saharan Africa Sub-Saharan Africa (excluding high income)Sub-Saharan Africa (IDA & IBRD countries)SudanSurinameSwazilandSyrian Arab RepublicTajikistanTanzaniaThailandTimor-LesteTogoTongaTrinidad and TobagoTunisiaTurkeyTurkmenistanTuvaluUgandaUkraineUpper middle incomeUruguayUzbekistanVanuatuVenezuela, RBVietnamWest Bank and GazaWorldYemen, Rep.ZambiaZimbabwe Timeline:
This timeline shows a graph from 1979 to 2015 of Kiribati. No data until 1978. Number of actual observations by date: 37.
Source name:
World Development Indicators
Source organization:
Development Assistance Committee of the Organisation for Economic Co-operation and Development, Geographical Distribution of Financial Flows to Developing Countries, Development Co-operation Report, and International Development Statistics database. Data are available online at: www.oecd.org/dac/stats/idsonline. World Bank GNI estimates are used for the denominator.
Categories, topics:
Aid Effectiveness, Economy & Growth, External Debt
Last updated:
apr 23, 2017
Indicators value changes by year
Minimum:
10.245
jan 1, 2011
Maximum:
50.059
jan 1, 1981
At the date of observation
Value
Absolute change
Change from previous value
jan 1, 1979
21.267
+21.267
0.0%
jan 1, 1980
18.678
-2.589
-12.17%
jan 1, 1981
50.059
+31.381
168.01%
jan 1, 1982
39.745
-10.313
-20.6%
jan 1, 1983
33.723
-6.022
-15.15%
jan 1, 1984
36.934
+3.211
9.52%
jan 1, 1985
31.357
-5.577
-15.1%
jan 1, 1986
38.769
+7.411
23.64%
jan 1, 1987
42.789
+4.021
10.37%
jan 1, 1988
49.593
+6.803
15.9%
jan 1, 1989
35.241
-14.352
-28.94%
jan 1, 1990
38.423
+3.182
9.03%
jan 1, 1991
41.872
+3.449
8.98%
jan 1, 1992
26.022
-15.85
-37.85%
jan 1, 1993
34.329
+8.307
31.92%
jan 1, 1994
21.641
-12.687
-36.96%
jan 1, 1995
18.119
-3.522
-16.28%
jan 1, 1996
16.784
-1.335
-7.37%
jan 1, 1997
13.79
-2.994
-17.84%
jan 1, 1998
14.006
+0.216
1.56%
jan 1, 1999
15.119
+1.114
7.95%
jan 1, 2000
18.652
+3.533
23.37%
jan 1, 2001
16.348
-2.305
-12.36%
jan 1, 2002
11.39
-4.957
-30.32%
jan 1, 2003
18.053
+6.662
58.49%
jan 1, 2004
13.924
-4.129
-22.87%
jan 1, 2005
10.792
-3.132
-22.49%
jan 1, 2006
17.371
+6.579
60.96%
jan 1, 2007
16.865
-0.506
-2.91%
jan 1, 2008
14.882
-1.983
-11.76%
jan 1, 2009
13.564
-1.319
-8.86%
jan 1, 2010
15.051
+1.488
10.97%
jan 1, 2011
10.245
-4.807
-31.93%
jan 1, 2012
26.295
+16.05
156.66%
jan 1, 2013
23.711
-2.584
-9.83%
jan 1, 2014
21.942
-1.769
-7.46%
jan 1, 2015
22.977
+1.035
4.72%
Ranking of countries by current statistics by years


Comments: