29
/
en
AIzaSyAYiBZKx7MnpbEhh9jyipgxe19OcubqV5w
April 1, 2024
272650
Uganda
UGA
true
2
1
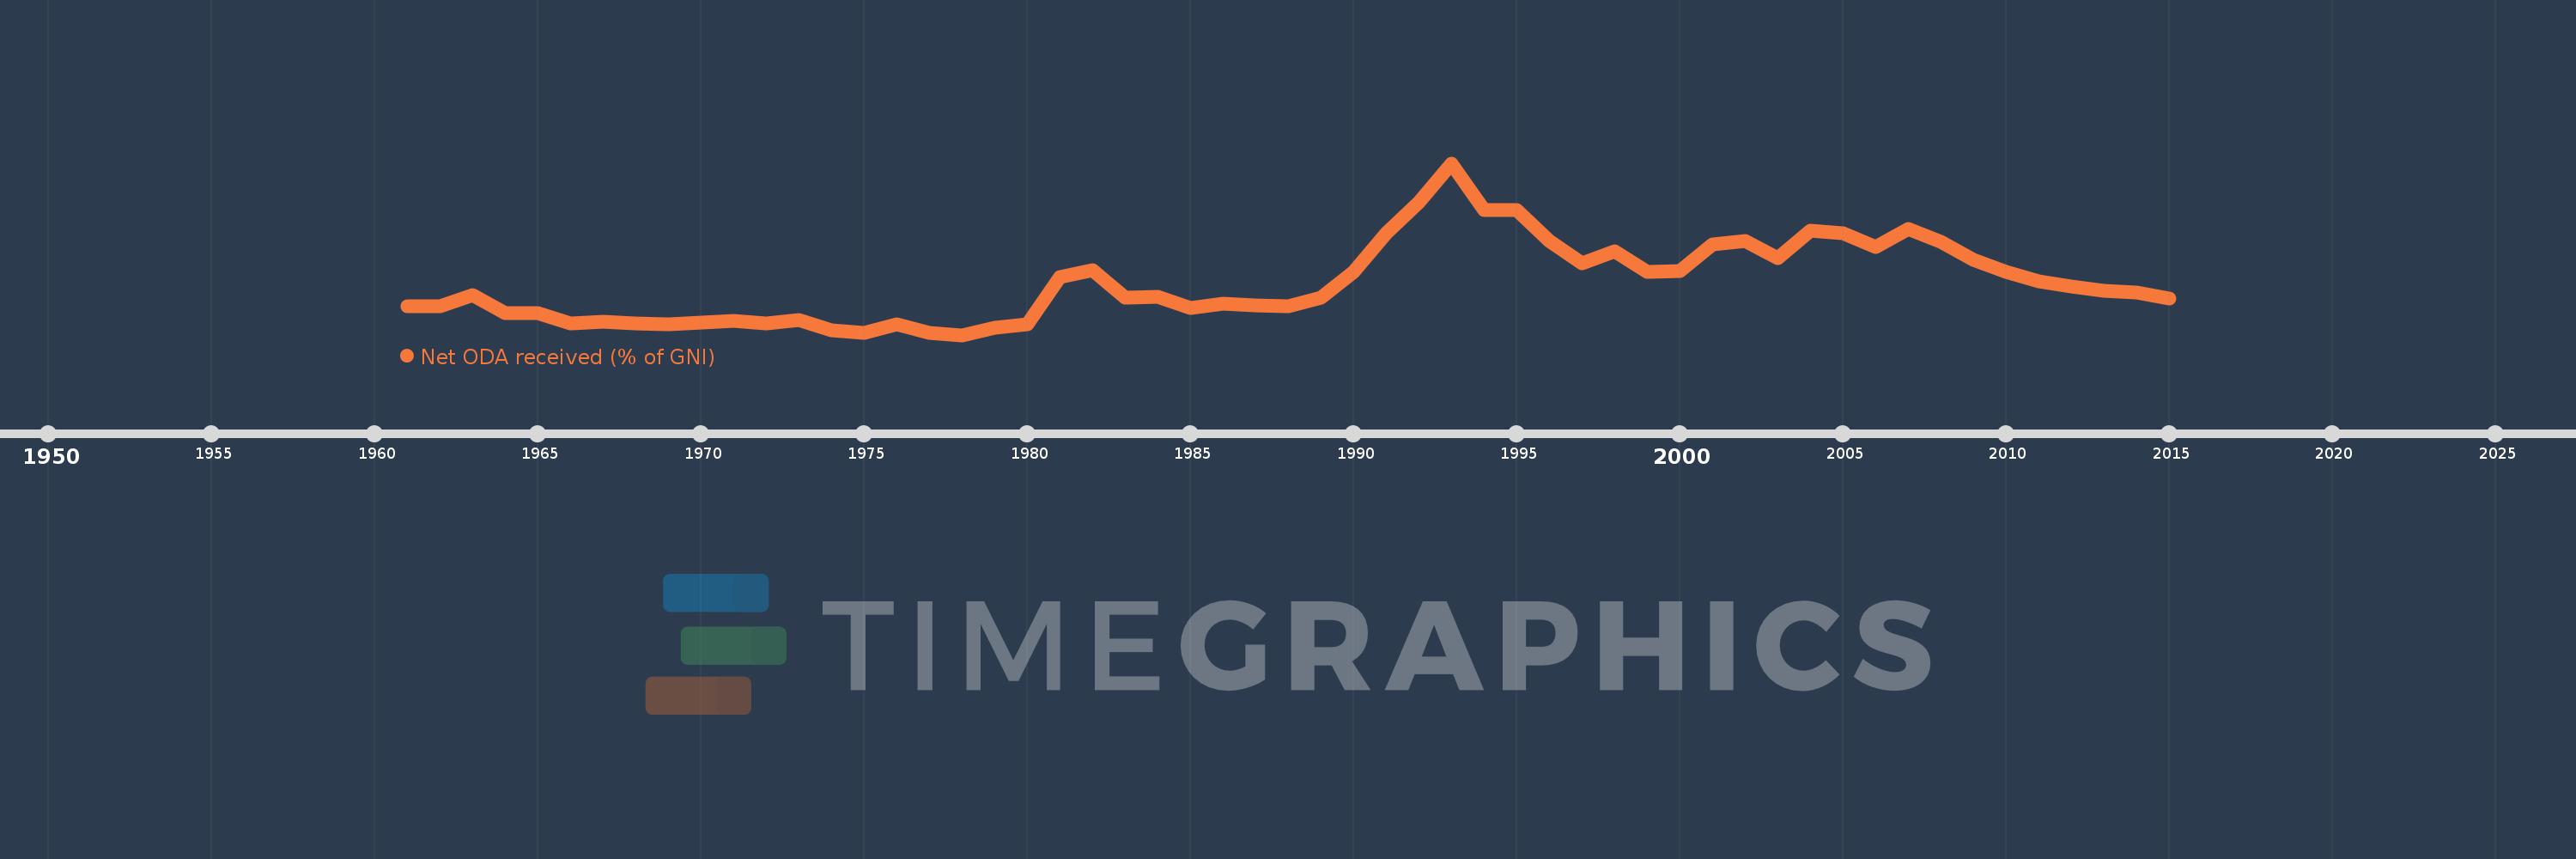
Net ODA received (% of GNI)
2015,2014,2013,2012,2011,2010,2009,2008,2007,2006,2005,2004,2003,2002,2001,2000,1999,1998,1997,1996,1995,1994,1993,1992,1991,1990,1989,1988,1987,1986,1985,1984,1983,1982,1981,1980,1979,1978,1977,1976,1975,1974,1973,1972,1971,1970,1969,1968,1967,1966,1965,1964,1963,1962,1961
This statistics in other country:
AfghanistanAlbaniaAlgeriaAngolaAntigua and BarbudaArab WorldArgentinaArmeniaAzerbaijanBahamas, TheBahrainBangladeshBarbadosBelarusBelizeBeninBermudaBhutanBoliviaBosnia and HerzegovinaBotswanaBrazilBrunei DarussalamBurkina FasoBurundiCabo VerdeCambodiaCameroonCaribbean small statesCentral African RepublicCentral Europe and the BalticsChadChileChinaColombiaComorosCongo, Dem. Rep.Congo, Rep.Costa RicaCote d'IvoireCroatiaCubaCyprusDjiboutiDominicaDominican RepublicEast Asia & PacificEast Asia & Pacific (excluding high income)East Asia & Pacific (IDA & IBRD countries)EcuadorEgypt, Arab Rep.El SalvadorEquatorial GuineaEritreaEthiopiaEuro areaEurope & Central AsiaEurope & Central Asia (excluding high income)Europe & Central Asia (IDA & IBRD countries)European UnionFijiFragile and conflict affected situationsFrench PolynesiaGabonGambia, TheGeorgiaGhanaGrenadaGuatemalaGuineaGuinea-BissauGuyanaHaitiHeavily indebted poor countries (HIPC)High incomeHondurasHong Kong SAR, ChinaIBRD onlyIDA & IBRD totalIDA blendIDA onlyIDA totalIndiaIndonesiaIran, Islamic Rep.IraqIsraelJamaicaJordanKazakhstanKenyaKiribatiKorea, Rep.KosovoKuwaitKyrgyz RepublicLao PDRLatin America & Caribbean Latin America & Caribbean (excluding high income)Latin America & the Caribbean (IDA & IBRD countries)Least developed countries: UN classificationLebanonLesothoLiberiaLibyaLow & middle incomeLow incomeLower middle incomeMacao SAR, ChinaMacedonia, FYRMadagascarMalawiMalaysiaMaldivesMaliMaltaMarshall IslandsMauritaniaMauritiusMexicoMicronesia, Fed. Sts.Middle East & North AfricaMiddle East & North Africa (excluding high income)Middle East & North Africa (IDA & IBRD countries)Middle incomeMoldovaMongoliaMontenegroMoroccoMozambiqueMyanmarNamibiaNauruNepalNew CaledoniaNicaraguaNigerNigeriaNorth AmericaOECD membersOmanOther small statesPacific island small statesPakistanPalauPanamaPapua New GuineaParaguayPeruPhilippinesQatarRwandaSamoaSao Tome and PrincipeSaudi ArabiaSenegalSerbiaSeychellesSierra LeoneSingaporeSloveniaSmall statesSolomon IslandsSomaliaSouth AfricaSouth AsiaSouth Asia (IDA & IBRD)South SudanSri LankaSt. Kitts and NevisSt. LuciaSt. Vincent and the GrenadinesSub-Saharan Africa Sub-Saharan Africa (excluding high income)Sub-Saharan Africa (IDA & IBRD countries)SudanSurinameSwazilandSyrian Arab RepublicTajikistanTanzaniaThailandTimor-LesteTogoTongaTrinidad and TobagoTunisiaTurkeyTurkmenistanTuvaluUgandaUkraineUpper middle incomeUruguayUzbekistanVanuatuVenezuela, RBVietnamWest Bank and GazaWorldYemen, Rep.ZambiaZimbabwe Timeline:
This timeline shows a graph from 1961 to 2015 of Uganda. No data until 1960. Number of actual observations by date: 55.
Source name:
World Development Indicators
Source organization:
Development Assistance Committee of the Organisation for Economic Co-operation and Development, Geographical Distribution of Financial Flows to Developing Countries, Development Co-operation Report, and International Development Statistics database. Data are available online at: www.oecd.org/dac/stats/idsonline. World Bank GNI estimates are used for the denominator.
Categories, topics:
Aid Effectiveness, Economy & Growth, External Debt
Last updated:
apr 23, 2017
Indicators value changes by year
Maximum:
26.123
jan 1, 1993
At the date of observation
Value
Absolute change
Change from previous value
jan 1, 1961
4.884
+4.884
0.0%
jan 1, 1962
4.82
-0.064
-1.3%
jan 1, 1963
6.471
+1.65
34.24%
jan 1, 1964
3.824
-2.647
-40.91%
jan 1, 1965
3.837
+0.013
0.34%
jan 1, 1966
2.323
-1.514
-39.46%
jan 1, 1967
2.596
+0.273
11.74%
jan 1, 1968
2.275
-0.321
-12.37%
jan 1, 1969
2.176
-0.098
-4.32%
jan 1, 1970
2.388
+0.212
9.74%
jan 1, 1971
2.643
+0.254
10.65%
jan 1, 1972
2.276
-0.366
-13.87%
jan 1, 1973
2.769
+0.492
21.63%
jan 1, 1974
1.312
-1.457
-52.61%
jan 1, 1975
0.841
-0.471
-35.89%
jan 1, 1976
2.201
+1.36
161.63%
jan 1, 1977
0.858
-1.343
-61.01%
jan 1, 1978
0.572
-0.287
-33.4%
jan 1, 1979
1.636
+1.065
186.34%
jan 1, 1980
2.221
+0.584
35.71%
jan 1, 1981
9.162
+6.941
312.54%
jan 1, 1982
10.239
+1.078
11.76%
jan 1, 1983
6.106
-4.133
-40.37%
jan 1, 1984
6.229
+0.123
2.02%
jan 1, 1985
4.541
-1.688
-27.09%
jan 1, 1986
5.177
+0.636
14.0%
jan 1, 1987
4.938
-0.239
-4.62%
jan 1, 1988
4.804
-0.134
-2.71%
jan 1, 1989
6.069
+1.265
26.33%
jan 1, 1990
9.913
+3.843
63.32%
jan 1, 1991
15.686
+5.773
58.24%
jan 1, 1992
20.324
+4.638
29.57%
jan 1, 1993
26.123
+5.799
28.53%
jan 1, 1994
19.208
-6.915
-26.47%
jan 1, 1995
19.117
-0.091
-0.47%
jan 1, 1996
14.623
-4.494
-23.51%
jan 1, 1997
11.23
-3.392
-23.2%
jan 1, 1998
13.003
+1.773
15.78%
jan 1, 1999
9.966
-3.037
-23.36%
jan 1, 2000
10.11
+0.144
1.45%
jan 1, 2001
14.021
+3.911
38.69%
jan 1, 2002
14.527
+0.506
3.61%
jan 1, 2003
12.001
-2.526
-17.39%
jan 1, 2004
16.078
+4.077
33.97%
jan 1, 2005
15.74
-0.338
-2.1%
jan 1, 2006
13.627
-2.113
-13.42%
jan 1, 2007
16.364
+2.737
20.08%
jan 1, 2008
14.409
-1.954
-11.94%
jan 1, 2009
11.741
-2.668
-18.52%
jan 1, 2010
9.996
-1.745
-14.87%
jan 1, 2011
8.504
-1.491
-14.92%
jan 1, 2012
7.81
-0.695
-8.17%
jan 1, 2013
7.127
-0.683
-8.74%
jan 1, 2014
6.952
-0.175
-2.46%
jan 1, 2015
6.015
-0.937
-13.48%
Ranking of countries by current statistics by years


Comments: