29
/
en
AIzaSyAYiBZKx7MnpbEhh9jyipgxe19OcubqV5w
April 1, 2024
165233
Jordan
JOR
true
2
1
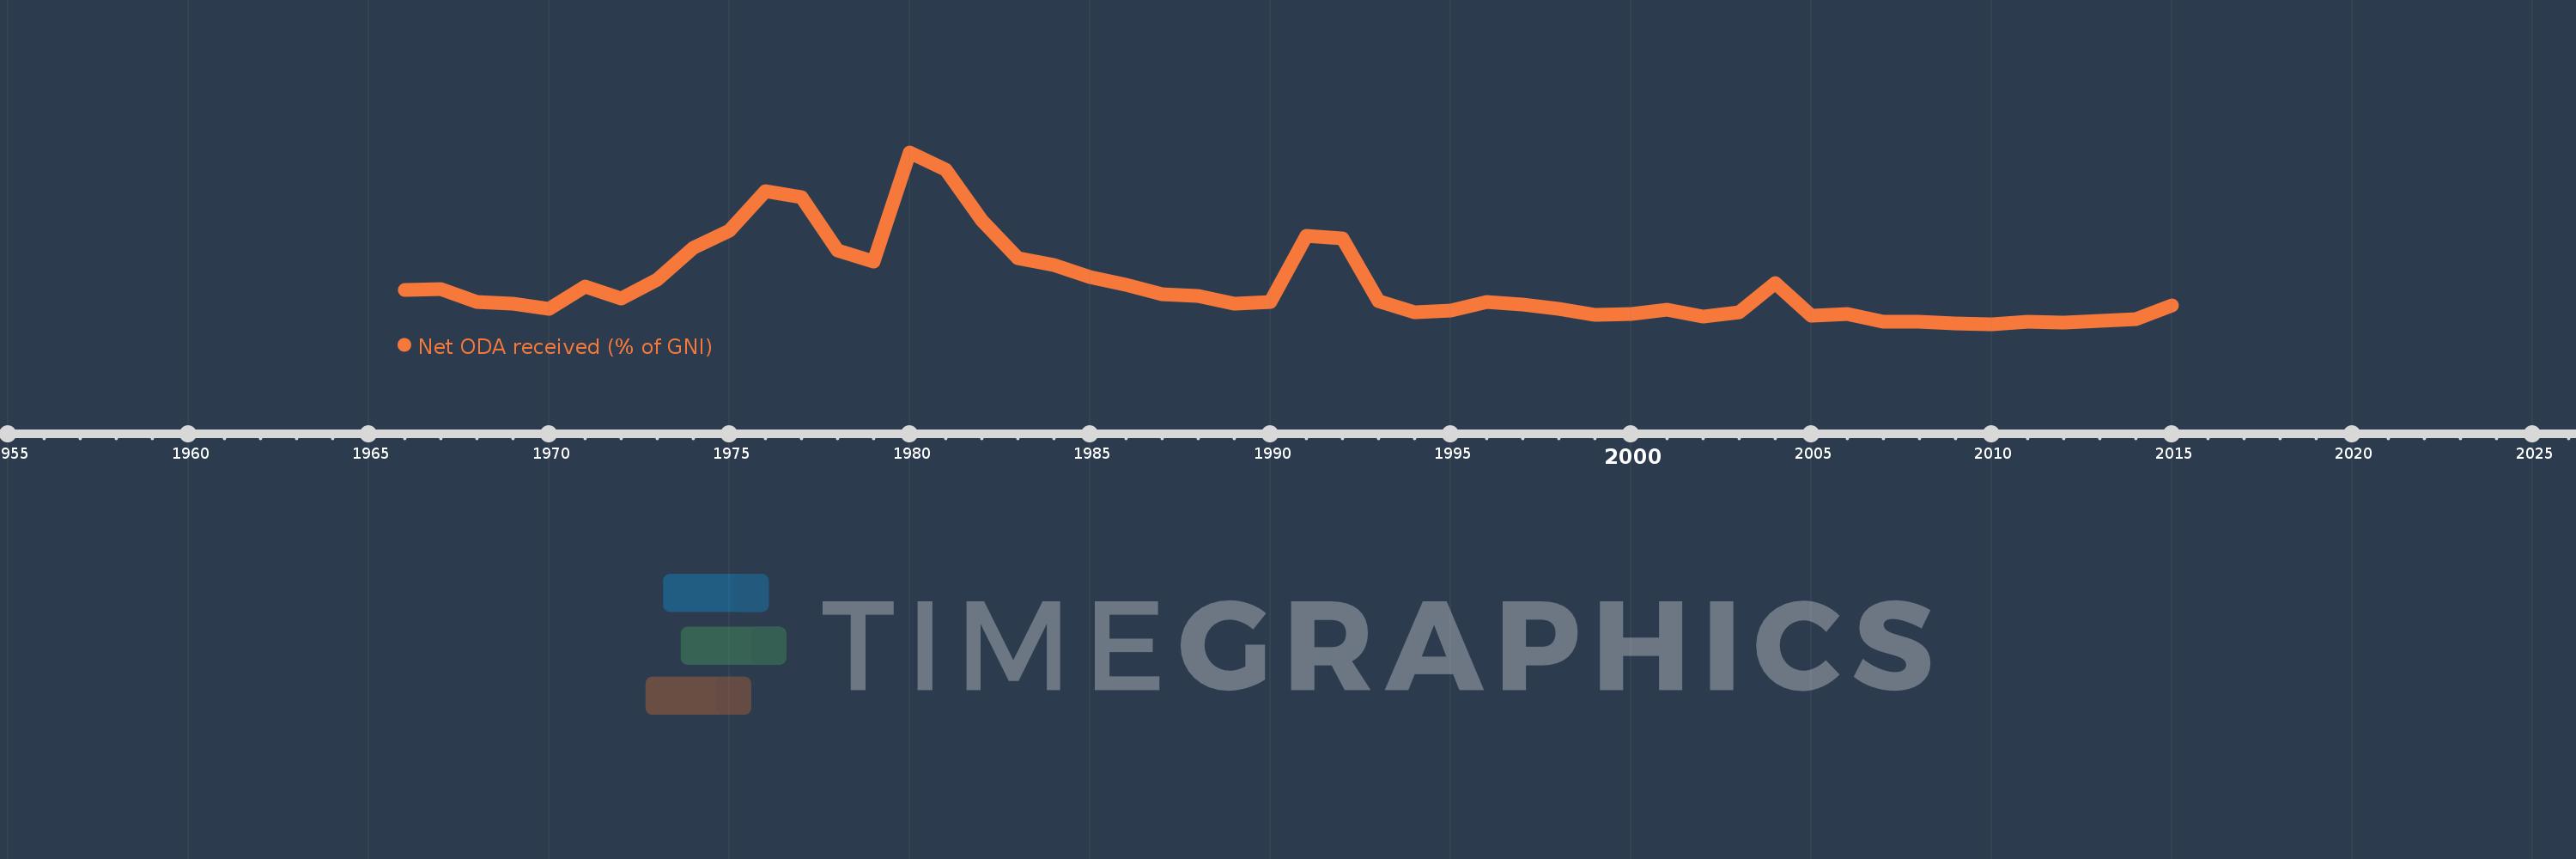
Net ODA received (% of GNI)
2015,2014,2013,2012,2011,2010,2009,2008,2007,2006,2005,2004,2003,2002,2001,2000,1999,1998,1997,1996,1995,1994,1993,1992,1991,1990,1989,1988,1987,1986,1985,1984,1983,1982,1981,1980,1979,1978,1977,1976,1975,1974,1973,1972,1971,1970,1969,1968,1967,1966
This statistics in other country:
AfghanistanAlbaniaAlgeriaAngolaAntigua and BarbudaArab WorldArgentinaArmeniaAzerbaijanBahamas, TheBahrainBangladeshBarbadosBelarusBelizeBeninBermudaBhutanBoliviaBosnia and HerzegovinaBotswanaBrazilBrunei DarussalamBurkina FasoBurundiCabo VerdeCambodiaCameroonCaribbean small statesCentral African RepublicCentral Europe and the BalticsChadChileChinaColombiaComorosCongo, Dem. Rep.Congo, Rep.Costa RicaCote d'IvoireCroatiaCubaCyprusDjiboutiDominicaDominican RepublicEast Asia & PacificEast Asia & Pacific (excluding high income)East Asia & Pacific (IDA & IBRD countries)EcuadorEgypt, Arab Rep.El SalvadorEquatorial GuineaEritreaEthiopiaEuro areaEurope & Central AsiaEurope & Central Asia (excluding high income)Europe & Central Asia (IDA & IBRD countries)European UnionFijiFragile and conflict affected situationsFrench PolynesiaGabonGambia, TheGeorgiaGhanaGrenadaGuatemalaGuineaGuinea-BissauGuyanaHaitiHeavily indebted poor countries (HIPC)High incomeHondurasHong Kong SAR, ChinaIBRD onlyIDA & IBRD totalIDA blendIDA onlyIDA totalIndiaIndonesiaIran, Islamic Rep.IraqIsraelJamaicaJordanKazakhstanKenyaKiribatiKorea, Rep.KosovoKuwaitKyrgyz RepublicLao PDRLatin America & Caribbean Latin America & Caribbean (excluding high income)Latin America & the Caribbean (IDA & IBRD countries)Least developed countries: UN classificationLebanonLesothoLiberiaLibyaLow & middle incomeLow incomeLower middle incomeMacao SAR, ChinaMacedonia, FYRMadagascarMalawiMalaysiaMaldivesMaliMaltaMarshall IslandsMauritaniaMauritiusMexicoMicronesia, Fed. Sts.Middle East & North AfricaMiddle East & North Africa (excluding high income)Middle East & North Africa (IDA & IBRD countries)Middle incomeMoldovaMongoliaMontenegroMoroccoMozambiqueMyanmarNamibiaNauruNepalNew CaledoniaNicaraguaNigerNigeriaNorth AmericaOECD membersOmanOther small statesPacific island small statesPakistanPalauPanamaPapua New GuineaParaguayPeruPhilippinesQatarRwandaSamoaSao Tome and PrincipeSaudi ArabiaSenegalSerbiaSeychellesSierra LeoneSingaporeSloveniaSmall statesSolomon IslandsSomaliaSouth AfricaSouth AsiaSouth Asia (IDA & IBRD)South SudanSri LankaSt. Kitts and NevisSt. LuciaSt. Vincent and the GrenadinesSub-Saharan Africa Sub-Saharan Africa (excluding high income)Sub-Saharan Africa (IDA & IBRD countries)SudanSurinameSwazilandSyrian Arab RepublicTajikistanTanzaniaThailandTimor-LesteTogoTongaTrinidad and TobagoTunisiaTurkeyTurkmenistanTuvaluUgandaUkraineUpper middle incomeUruguayUzbekistanVanuatuVenezuela, RBVietnamWest Bank and GazaWorldYemen, Rep.ZambiaZimbabwe Timeline:
This timeline shows a graph from 1966 to 2015 of Jordan. No data until 1965. Number of actual observations by date: 50.
Source name:
World Development Indicators
Source organization:
Development Assistance Committee of the Organisation for Economic Co-operation and Development, Geographical Distribution of Financial Flows to Developing Countries, Development Co-operation Report, and International Development Statistics database. Data are available online at: www.oecd.org/dac/stats/idsonline. World Bank GNI estimates are used for the denominator.
Categories, topics:
Aid Effectiveness, Economy & Growth, External Debt
Last updated:
apr 23, 2017
Indicators value changes by year
Maximum:
44.168
jan 1, 1980
At the date of observation
Value
Absolute change
Change from previous value
jan 1, 1966
11.336
+11.336
0.0%
jan 1, 1967
11.483
+0.147
1.3%
jan 1, 1968
8.31
-3.173
-27.63%
jan 1, 1969
7.939
-0.371
-4.47%
jan 1, 1970
6.762
-1.177
-14.83%
jan 1, 1971
12.164
+5.402
79.89%
jan 1, 1972
9.279
-2.885
-23.72%
jan 1, 1973
13.66
+4.381
47.22%
jan 1, 1974
21.31
+7.649
56.0%
jan 1, 1975
25.407
+4.098
19.23%
jan 1, 1976
34.981
+9.574
37.68%
jan 1, 1977
33.422
-1.559
-4.46%
jan 1, 1978
20.796
-12.625
-37.78%
jan 1, 1979
17.947
-2.849
-13.7%
jan 1, 1980
44.168
+26.22
146.1%
jan 1, 1981
39.945
-4.222
-9.56%
jan 1, 1982
27.933
-12.012
-30.07%
jan 1, 1983
18.939
-8.994
-32.2%
jan 1, 1984
17.2
-1.739
-9.18%
jan 1, 1985
14.296
-2.905
-16.89%
jan 1, 1986
12.383
-1.912
-13.38%
jan 1, 1987
10.124
-2.259
-18.24%
jan 1, 1988
9.893
-0.232
-2.29%
jan 1, 1989
7.968
-1.925
-19.45%
jan 1, 1990
8.407
+0.438
5.5%
jan 1, 1991
24.123
+15.717
186.96%
jan 1, 1992
23.59
-0.533
-2.21%
jan 1, 1993
8.568
-15.022
-63.68%
jan 1, 1994
5.846
-2.723
-31.78%
jan 1, 1995
6.29
+0.444
7.6%
jan 1, 1996
8.36
+2.07
32.91%
jan 1, 1997
7.653
-0.708
-8.47%
jan 1, 1998
6.717
-0.936
-12.23%
jan 1, 1999
5.307
-1.41
-20.99%
jan 1, 2000
5.427
+0.12
2.26%
jan 1, 2001
6.458
+1.032
19.01%
jan 1, 2002
4.92
-1.538
-23.82%
jan 1, 2003
5.831
+0.911
18.53%
jan 1, 2004
12.843
+7.012
120.24%
jan 1, 2005
5.162
-7.681
-59.81%
jan 1, 2006
5.481
+0.319
6.19%
jan 1, 2007
3.692
-1.79
-32.65%
jan 1, 2008
3.598
-0.094
-2.54%
jan 1, 2009
3.255
-0.343
-9.52%
jan 1, 2010
3.044
-0.212
-6.51%
jan 1, 2011
3.628
+0.585
19.21%
jan 1, 2012
3.398
-0.23
-6.35%
jan 1, 2013
3.788
+0.39
11.49%
jan 1, 2014
4.218
+0.43
11.34%
jan 1, 2015
7.622
+3.404
80.71%
Ranking of countries by current statistics by years


Comments: