29
/
en
AIzaSyAYiBZKx7MnpbEhh9jyipgxe19OcubqV5w
April 1, 2024
262656
Thailand
THA
true
2
1
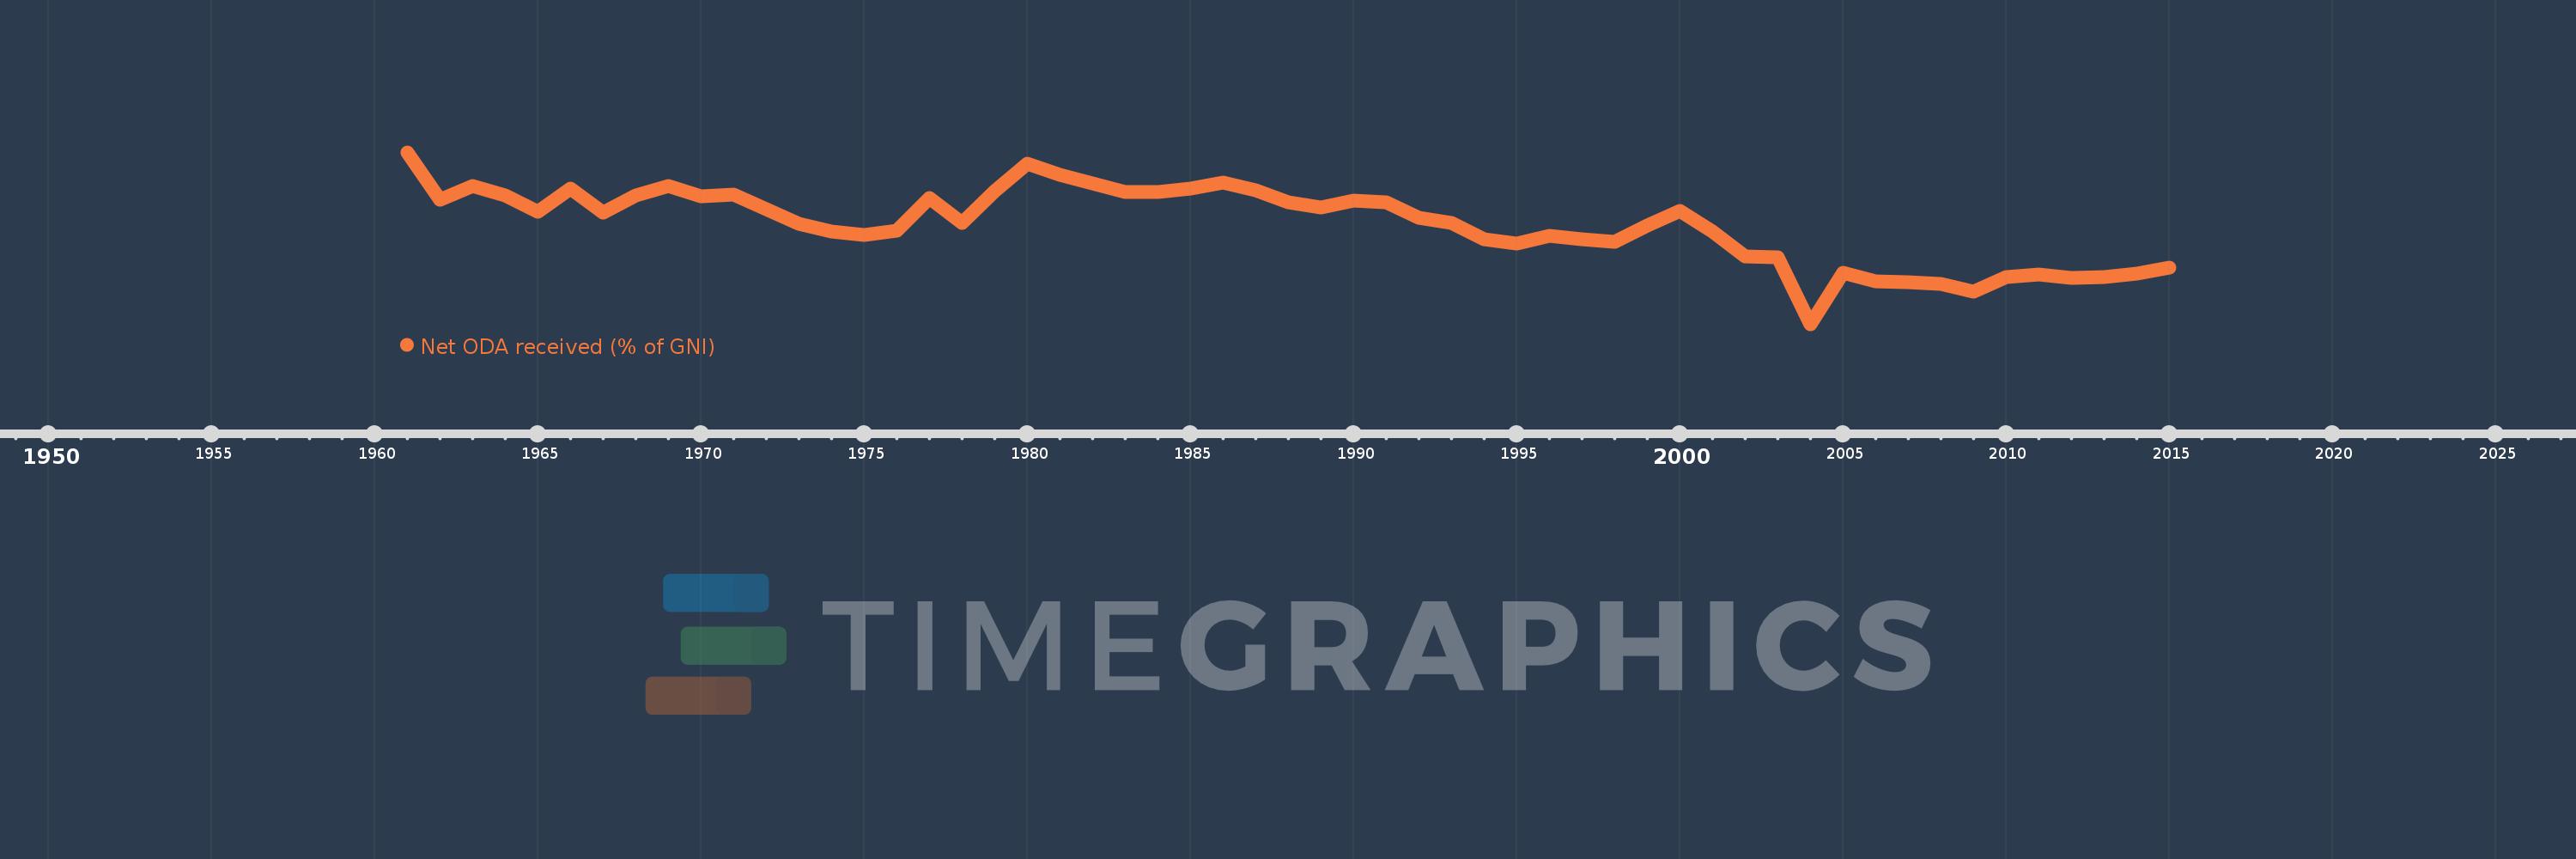
Net ODA received (% of GNI)
2015,2014,2013,2012,2011,2010,2009,2008,2007,2006,2005,2004,2003,2002,2001,2000,1999,1998,1997,1996,1995,1994,1993,1992,1991,1990,1989,1988,1987,1986,1985,1984,1983,1982,1981,1980,1979,1978,1977,1976,1975,1974,1973,1972,1971,1970,1969,1968,1967,1966,1965,1964,1963,1962,1961
This statistics in other country:
AfghanistanAlbaniaAlgeriaAngolaAntigua and BarbudaArab WorldArgentinaArmeniaAzerbaijanBahamas, TheBahrainBangladeshBarbadosBelarusBelizeBeninBermudaBhutanBoliviaBosnia and HerzegovinaBotswanaBrazilBrunei DarussalamBurkina FasoBurundiCabo VerdeCambodiaCameroonCaribbean small statesCentral African RepublicCentral Europe and the BalticsChadChileChinaColombiaComorosCongo, Dem. Rep.Congo, Rep.Costa RicaCote d'IvoireCroatiaCubaCyprusDjiboutiDominicaDominican RepublicEast Asia & PacificEast Asia & Pacific (excluding high income)East Asia & Pacific (IDA & IBRD countries)EcuadorEgypt, Arab Rep.El SalvadorEquatorial GuineaEritreaEthiopiaEuro areaEurope & Central AsiaEurope & Central Asia (excluding high income)Europe & Central Asia (IDA & IBRD countries)European UnionFijiFragile and conflict affected situationsFrench PolynesiaGabonGambia, TheGeorgiaGhanaGrenadaGuatemalaGuineaGuinea-BissauGuyanaHaitiHeavily indebted poor countries (HIPC)High incomeHondurasHong Kong SAR, ChinaIBRD onlyIDA & IBRD totalIDA blendIDA onlyIDA totalIndiaIndonesiaIran, Islamic Rep.IraqIsraelJamaicaJordanKazakhstanKenyaKiribatiKorea, Rep.KosovoKuwaitKyrgyz RepublicLao PDRLatin America & Caribbean Latin America & Caribbean (excluding high income)Latin America & the Caribbean (IDA & IBRD countries)Least developed countries: UN classificationLebanonLesothoLiberiaLibyaLow & middle incomeLow incomeLower middle incomeMacao SAR, ChinaMacedonia, FYRMadagascarMalawiMalaysiaMaldivesMaliMaltaMarshall IslandsMauritaniaMauritiusMexicoMicronesia, Fed. Sts.Middle East & North AfricaMiddle East & North Africa (excluding high income)Middle East & North Africa (IDA & IBRD countries)Middle incomeMoldovaMongoliaMontenegroMoroccoMozambiqueMyanmarNamibiaNauruNepalNew CaledoniaNicaraguaNigerNigeriaNorth AmericaOECD membersOmanOther small statesPacific island small statesPakistanPalauPanamaPapua New GuineaParaguayPeruPhilippinesQatarRwandaSamoaSao Tome and PrincipeSaudi ArabiaSenegalSerbiaSeychellesSierra LeoneSingaporeSloveniaSmall statesSolomon IslandsSomaliaSouth AfricaSouth AsiaSouth Asia (IDA & IBRD)South SudanSri LankaSt. Kitts and NevisSt. LuciaSt. Vincent and the GrenadinesSub-Saharan Africa Sub-Saharan Africa (excluding high income)Sub-Saharan Africa (IDA & IBRD countries)SudanSurinameSwazilandSyrian Arab RepublicTajikistanTanzaniaThailandTimor-LesteTogoTongaTrinidad and TobagoTunisiaTurkeyTurkmenistanTuvaluUgandaUkraineUpper middle incomeUruguayUzbekistanVanuatuVenezuela, RBVietnamWest Bank and GazaWorldYemen, Rep.ZambiaZimbabwe Timeline:
This timeline shows a graph from 1961 to 2015 of Thailand. No data until 1960. Number of actual observations by date: 55.
Source name:
World Development Indicators
Source organization:
Development Assistance Committee of the Organisation for Economic Co-operation and Development, Geographical Distribution of Financial Flows to Developing Countries, Development Co-operation Report, and International Development Statistics database. Data are available online at: www.oecd.org/dac/stats/idsonline. World Bank GNI estimates are used for the denominator.
Categories, topics:
Aid Effectiveness, Economy & Growth, External Debt
Last updated:
apr 23, 2017
Indicators value changes by year
Minimum:
-0.646
jan 1, 2004
At the date of observation
Value
Absolute change
Change from previous value
jan 1, 1961
1.59
+1.59
0.0%
jan 1, 1962
0.969
-0.621
-39.03%
jan 1, 1963
1.148
+0.178
18.4%
jan 1, 1964
1.028
-0.119
-10.4%
jan 1, 1965
0.821
-0.208
-20.2%
jan 1, 1966
1.119
+0.299
36.39%
jan 1, 1967
0.802
-0.317
-28.36%
jan 1, 1968
1.031
+0.229
28.61%
jan 1, 1969
1.151
+0.12
11.63%
jan 1, 1970
1.018
-0.133
-11.52%
jan 1, 1971
1.043
+0.024
2.37%
jan 1, 1972
0.851
-0.192
-18.41%
jan 1, 1973
0.658
-0.192
-22.61%
jan 1, 1974
0.563
-0.095
-14.46%
jan 1, 1975
0.517
-0.046
-8.14%
jan 1, 1976
0.568
+0.051
9.86%
jan 1, 1977
0.993
+0.425
74.8%
jan 1, 1978
0.669
-0.325
-32.7%
jan 1, 1979
1.086
+0.417
62.42%
jan 1, 1980
1.445
+0.359
33.07%
jan 1, 1981
1.302
-0.143
-9.91%
jan 1, 1982
1.182
-0.12
-9.24%
jan 1, 1983
1.075
-0.107
-9.04%
jan 1, 1984
1.073
-0.002
-0.21%
jan 1, 1985
1.116
+0.043
4.02%
jan 1, 1986
1.196
+0.08
7.18%
jan 1, 1987
1.099
-0.097
-8.08%
jan 1, 1988
0.943
-0.156
-14.21%
jan 1, 1989
0.876
-0.067
-7.08%
jan 1, 1990
0.963
+0.087
9.89%
jan 1, 1991
0.944
-0.019
-1.94%
jan 1, 1992
0.737
-0.207
-21.91%
jan 1, 1993
0.677
-0.06
-8.16%
jan 1, 1994
0.458
-0.219
-32.32%
jan 1, 1995
0.4
-0.058
-12.66%
jan 1, 1996
0.504
+0.104
25.99%
jan 1, 1997
0.464
-0.04
-7.95%
jan 1, 1998
0.428
-0.036
-7.84%
jan 1, 1999
0.639
+0.211
49.38%
jan 1, 2000
0.825
+0.187
29.19%
jan 1, 2001
0.562
-0.263
-31.89%
jan 1, 2002
0.24
-0.322
-57.36%
jan 1, 2003
0.226
-0.013
-5.59%
jan 1, 2004
-0.646
-0.872
-385.27%
jan 1, 2005
0.029
+0.674
-104.43%
jan 1, 2006
-0.093
-0.121
-423.98%
jan 1, 2007
-0.102
-0.009
9.64%
jan 1, 2008
-0.122
-0.021
20.4%
jan 1, 2009
-0.219
-0.097
79.21%
jan 1, 2010
-0.029
+0.191
-86.96%
jan 1, 2011
-0.004
+0.025
-87.02%
jan 1, 2012
-0.038
-0.034
922.43%
jan 1, 2013
-0.035
+0.003
-6.64%
jan 1, 2014
0.007
+0.042
-118.77%
jan 1, 2015
0.091
+0.085
1.27K%
Ranking of countries by current statistics by years


Comments: