29
/
en
AIzaSyAYiBZKx7MnpbEhh9jyipgxe19OcubqV5w
April 1, 2024
186899
Malawi
MWI
true
2
1
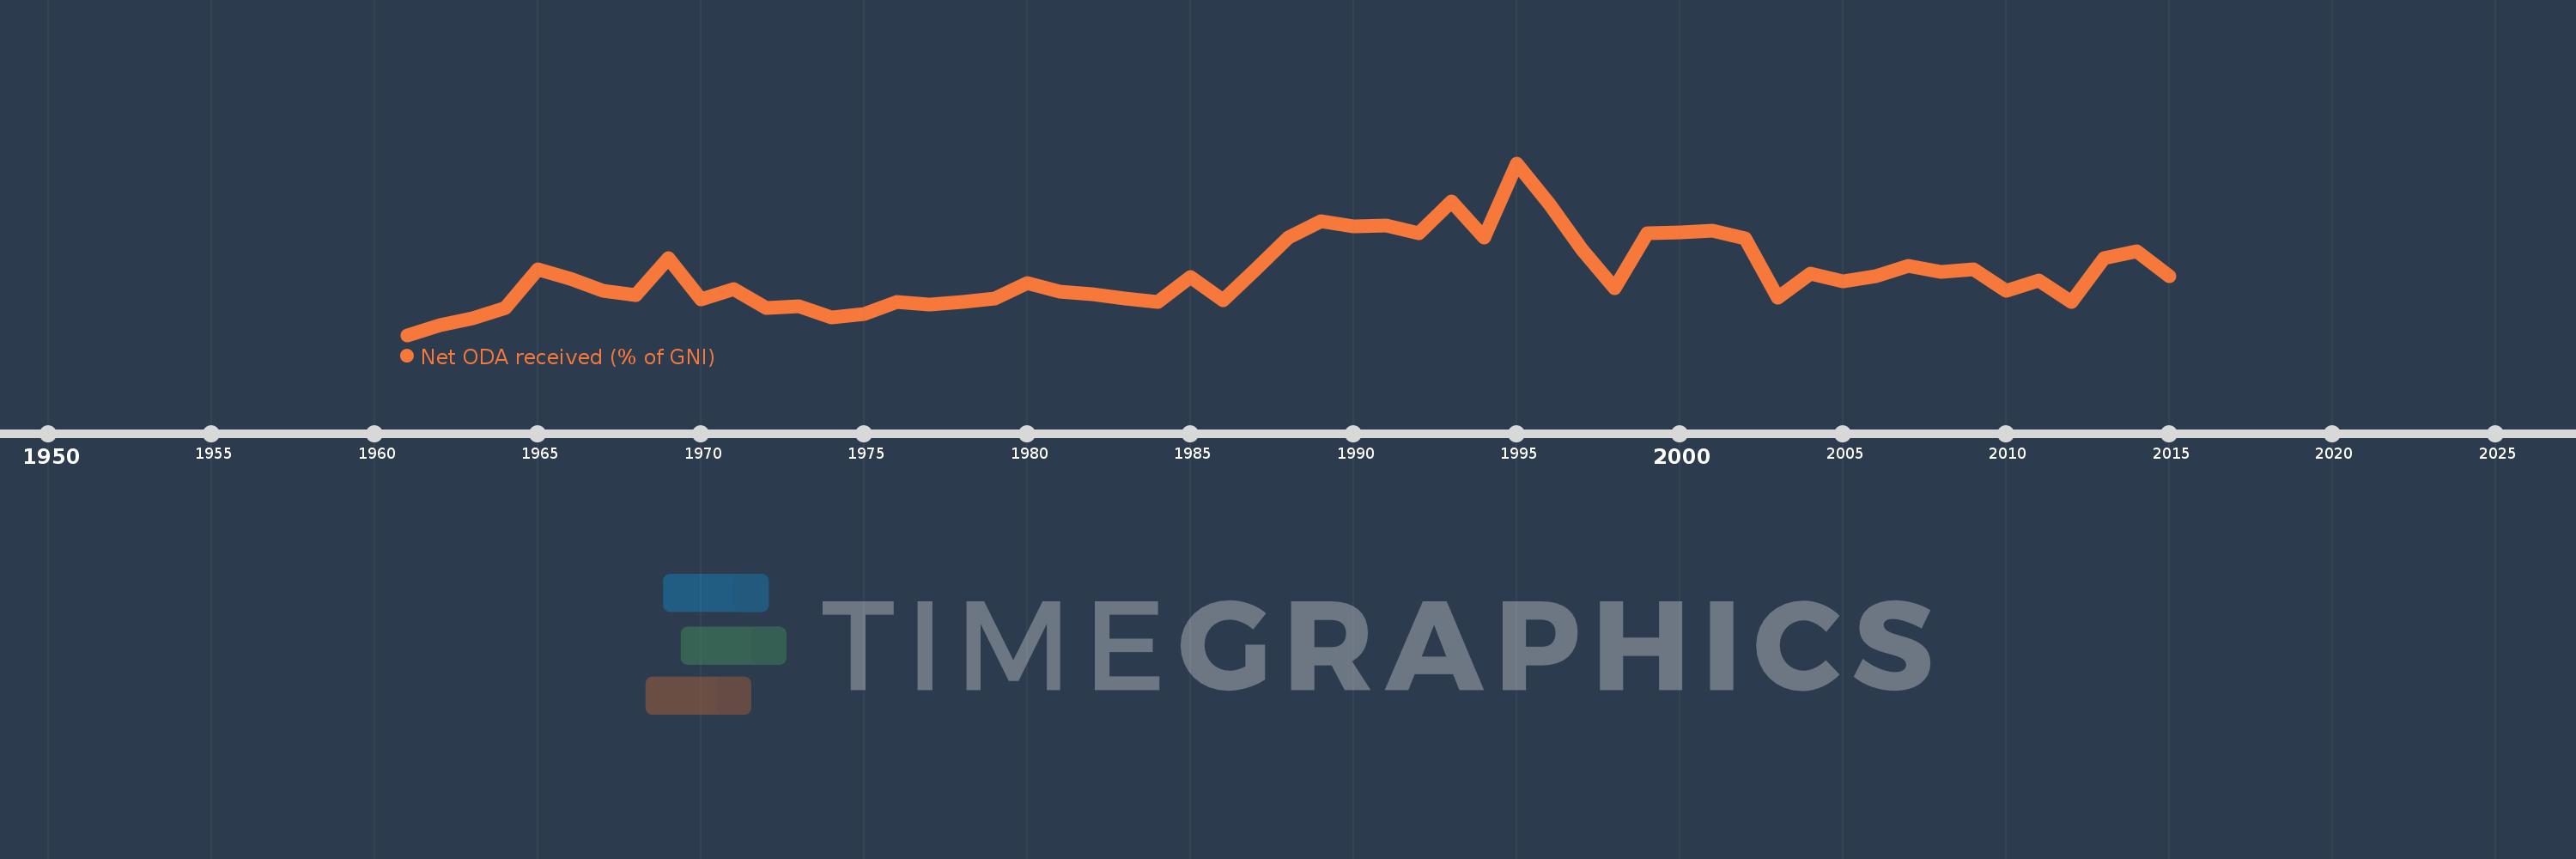
Net ODA received (% of GNI)
2015,2014,2013,2012,2011,2010,2009,2008,2007,2006,2005,2004,2003,2002,2001,2000,1999,1998,1997,1996,1995,1994,1993,1992,1991,1990,1989,1988,1987,1986,1985,1984,1983,1982,1981,1980,1979,1978,1977,1976,1975,1974,1973,1972,1971,1970,1969,1968,1967,1966,1965,1964,1963,1962,1961
This statistics in other country:
AfghanistanAlbaniaAlgeriaAngolaAntigua and BarbudaArab WorldArgentinaArmeniaAzerbaijanBahamas, TheBahrainBangladeshBarbadosBelarusBelizeBeninBermudaBhutanBoliviaBosnia and HerzegovinaBotswanaBrazilBrunei DarussalamBurkina FasoBurundiCabo VerdeCambodiaCameroonCaribbean small statesCentral African RepublicCentral Europe and the BalticsChadChileChinaColombiaComorosCongo, Dem. Rep.Congo, Rep.Costa RicaCote d'IvoireCroatiaCubaCyprusDjiboutiDominicaDominican RepublicEast Asia & PacificEast Asia & Pacific (excluding high income)East Asia & Pacific (IDA & IBRD countries)EcuadorEgypt, Arab Rep.El SalvadorEquatorial GuineaEritreaEthiopiaEuro areaEurope & Central AsiaEurope & Central Asia (excluding high income)Europe & Central Asia (IDA & IBRD countries)European UnionFijiFragile and conflict affected situationsFrench PolynesiaGabonGambia, TheGeorgiaGhanaGrenadaGuatemalaGuineaGuinea-BissauGuyanaHaitiHeavily indebted poor countries (HIPC)High incomeHondurasHong Kong SAR, ChinaIBRD onlyIDA & IBRD totalIDA blendIDA onlyIDA totalIndiaIndonesiaIran, Islamic Rep.IraqIsraelJamaicaJordanKazakhstanKenyaKiribatiKorea, Rep.KosovoKuwaitKyrgyz RepublicLao PDRLatin America & Caribbean Latin America & Caribbean (excluding high income)Latin America & the Caribbean (IDA & IBRD countries)Least developed countries: UN classificationLebanonLesothoLiberiaLibyaLow & middle incomeLow incomeLower middle incomeMacao SAR, ChinaMacedonia, FYRMadagascarMalawiMalaysiaMaldivesMaliMaltaMarshall IslandsMauritaniaMauritiusMexicoMicronesia, Fed. Sts.Middle East & North AfricaMiddle East & North Africa (excluding high income)Middle East & North Africa (IDA & IBRD countries)Middle incomeMoldovaMongoliaMontenegroMoroccoMozambiqueMyanmarNamibiaNauruNepalNew CaledoniaNicaraguaNigerNigeriaNorth AmericaOECD membersOmanOther small statesPacific island small statesPakistanPalauPanamaPapua New GuineaParaguayPeruPhilippinesQatarRwandaSamoaSao Tome and PrincipeSaudi ArabiaSenegalSerbiaSeychellesSierra LeoneSingaporeSloveniaSmall statesSolomon IslandsSomaliaSouth AfricaSouth AsiaSouth Asia (IDA & IBRD)South SudanSri LankaSt. Kitts and NevisSt. LuciaSt. Vincent and the GrenadinesSub-Saharan Africa Sub-Saharan Africa (excluding high income)Sub-Saharan Africa (IDA & IBRD countries)SudanSurinameSwazilandSyrian Arab RepublicTajikistanTanzaniaThailandTimor-LesteTogoTongaTrinidad and TobagoTunisiaTurkeyTurkmenistanTuvaluUgandaUkraineUpper middle incomeUruguayUzbekistanVanuatuVenezuela, RBVietnamWest Bank and GazaWorldYemen, Rep.ZambiaZimbabwe Timeline:
This timeline shows a graph from 1961 to 2015 of Malawi. No data until 1960. Number of actual observations by date: 55.
Source name:
World Development Indicators
Source organization:
Development Assistance Committee of the Organisation for Economic Co-operation and Development, Geographical Distribution of Financial Flows to Developing Countries, Development Co-operation Report, and International Development Statistics database. Data are available online at: www.oecd.org/dac/stats/idsonline. World Bank GNI estimates are used for the denominator.
Categories, topics:
Aid Effectiveness, Economy & Growth, External Debt
Last updated:
apr 23, 2017
Indicators value changes by year
Maximum:
41.291
jan 1, 1995
At the date of observation
Value
Absolute change
Change from previous value
jan 1, 1961
2.588
+2.588
0.0%
jan 1, 1962
4.799
+2.21
85.4%
jan 1, 1963
6.409
+1.61
33.55%
jan 1, 1964
8.728
+2.32
36.2%
jan 1, 1965
17.487
+8.758
100.34%
jan 1, 1966
15.176
-2.31
-13.21%
jan 1, 1967
12.548
-2.628
-17.32%
jan 1, 1968
11.597
-0.952
-7.59%
jan 1, 1969
19.822
+8.225
70.93%
jan 1, 1970
10.624
-9.197
-46.4%
jan 1, 1971
12.978
+2.354
22.16%
jan 1, 1972
8.721
-4.257
-32.8%
jan 1, 1973
9.009
+0.288
3.3%
jan 1, 1974
6.65
-2.36
-26.19%
jan 1, 1975
7.347
+0.697
10.48%
jan 1, 1976
10.102
+2.755
37.5%
jan 1, 1977
9.477
-0.624
-6.18%
jan 1, 1978
10.106
+0.629
6.64%
jan 1, 1979
10.773
+0.666
6.59%
jan 1, 1980
14.294
+3.521
32.68%
jan 1, 1981
12.408
-1.886
-13.19%
jan 1, 1982
11.832
-0.576
-4.64%
jan 1, 1983
10.832
-1.001
-8.46%
jan 1, 1984
10.022
-0.809
-7.47%
jan 1, 1985
15.736
+5.713
57.01%
jan 1, 1986
10.428
-5.308
-33.73%
jan 1, 1987
17.319
+6.891
66.08%
jan 1, 1988
24.494
+7.175
41.43%
jan 1, 1989
28.324
+3.83
15.64%
jan 1, 1990
27.091
-1.233
-4.35%
jan 1, 1991
27.231
+0.139
0.51%
jan 1, 1992
25.478
-1.753
-6.44%
jan 1, 1993
32.776
+7.298
28.64%
jan 1, 1994
24.464
-8.312
-25.36%
jan 1, 1995
41.291
+16.827
68.78%
jan 1, 1996
32.157
-9.134
-22.12%
jan 1, 1997
21.924
-10.233
-31.82%
jan 1, 1998
13.117
-8.806
-40.17%
jan 1, 1999
25.423
+12.306
93.81%
jan 1, 2000
25.754
+0.331
1.3%
jan 1, 2001
26.132
+0.378
1.47%
jan 1, 2002
24.322
-1.81
-6.92%
jan 1, 2003
10.957
-13.366
-54.95%
jan 1, 2004
16.357
+5.4
49.29%
jan 1, 2005
14.739
-1.618
-9.89%
jan 1, 2006
15.856
+1.117
7.58%
jan 1, 2007
18.252
+2.396
15.11%
jan 1, 2008
16.868
-1.384
-7.58%
jan 1, 2009
17.431
+0.564
3.34%
jan 1, 2010
12.571
-4.86
-27.88%
jan 1, 2011
14.815
+2.245
17.86%
jan 1, 2012
10.128
-4.687
-31.64%
jan 1, 2013
19.989
+9.86
97.35%
jan 1, 2014
21.422
+1.434
7.17%
jan 1, 2015
15.78
-5.642
-26.34%
Ranking of countries by current statistics by years


Comments: