29
/
en
AIzaSyAYiBZKx7MnpbEhh9jyipgxe19OcubqV5w
April 1, 2024
107654
Colombia
COL
true
2
1
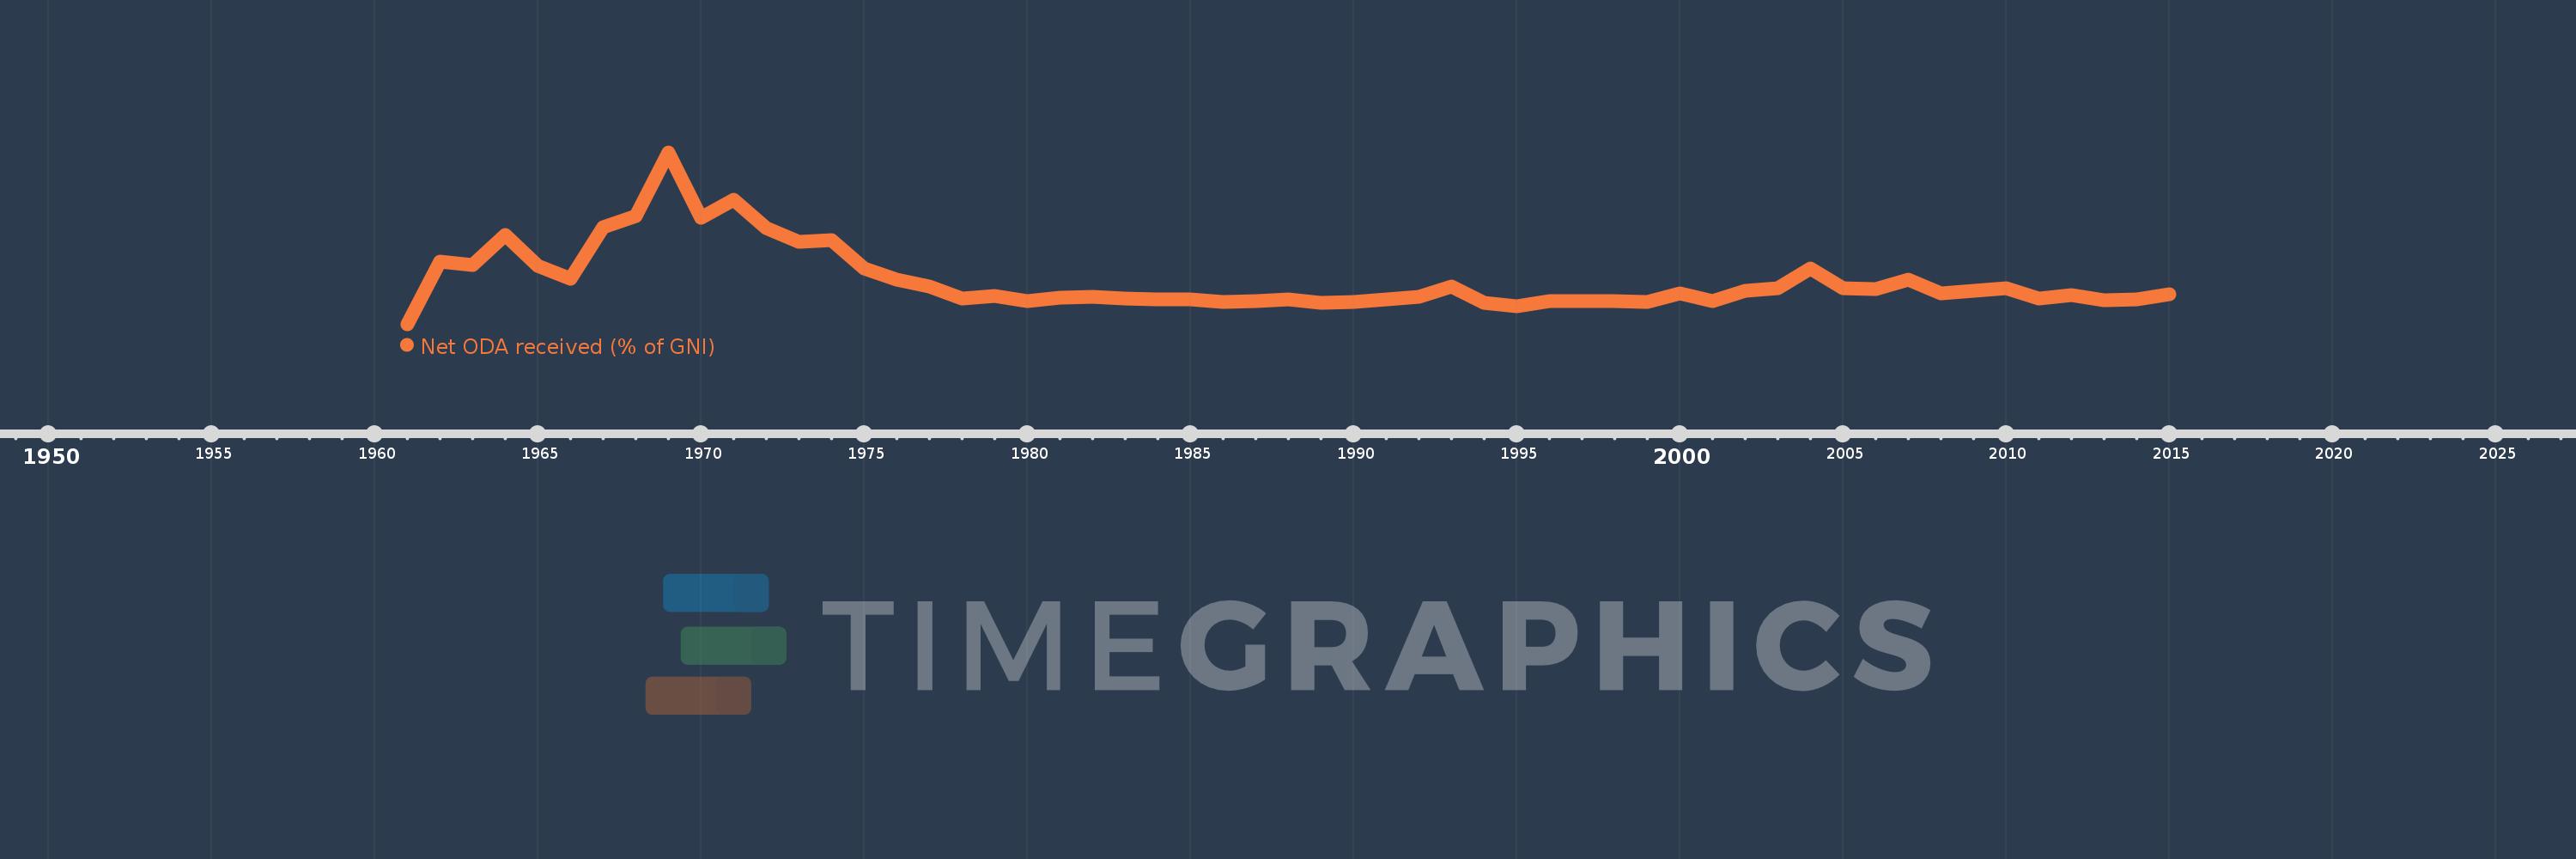
Net ODA received (% of GNI)
2015,2014,2013,2012,2011,2010,2009,2008,2007,2006,2005,2004,2003,2002,2001,2000,1999,1998,1997,1996,1995,1994,1993,1992,1991,1990,1989,1988,1987,1986,1985,1984,1983,1982,1981,1980,1979,1978,1977,1976,1975,1974,1973,1972,1971,1970,1969,1968,1967,1966,1965,1964,1963,1962,1961
This statistics in other country:
AfghanistanAlbaniaAlgeriaAngolaAntigua and BarbudaArab WorldArgentinaArmeniaAzerbaijanBahamas, TheBahrainBangladeshBarbadosBelarusBelizeBeninBermudaBhutanBoliviaBosnia and HerzegovinaBotswanaBrazilBrunei DarussalamBurkina FasoBurundiCabo VerdeCambodiaCameroonCaribbean small statesCentral African RepublicCentral Europe and the BalticsChadChileChinaColombiaComorosCongo, Dem. Rep.Congo, Rep.Costa RicaCote d'IvoireCroatiaCubaCyprusDjiboutiDominicaDominican RepublicEast Asia & PacificEast Asia & Pacific (excluding high income)East Asia & Pacific (IDA & IBRD countries)EcuadorEgypt, Arab Rep.El SalvadorEquatorial GuineaEritreaEthiopiaEuro areaEurope & Central AsiaEurope & Central Asia (excluding high income)Europe & Central Asia (IDA & IBRD countries)European UnionFijiFragile and conflict affected situationsFrench PolynesiaGabonGambia, TheGeorgiaGhanaGrenadaGuatemalaGuineaGuinea-BissauGuyanaHaitiHeavily indebted poor countries (HIPC)High incomeHondurasHong Kong SAR, ChinaIBRD onlyIDA & IBRD totalIDA blendIDA onlyIDA totalIndiaIndonesiaIran, Islamic Rep.IraqIsraelJamaicaJordanKazakhstanKenyaKiribatiKorea, Rep.KosovoKuwaitKyrgyz RepublicLao PDRLatin America & Caribbean Latin America & Caribbean (excluding high income)Latin America & the Caribbean (IDA & IBRD countries)Least developed countries: UN classificationLebanonLesothoLiberiaLibyaLow & middle incomeLow incomeLower middle incomeMacao SAR, ChinaMacedonia, FYRMadagascarMalawiMalaysiaMaldivesMaliMaltaMarshall IslandsMauritaniaMauritiusMexicoMicronesia, Fed. Sts.Middle East & North AfricaMiddle East & North Africa (excluding high income)Middle East & North Africa (IDA & IBRD countries)Middle incomeMoldovaMongoliaMontenegroMoroccoMozambiqueMyanmarNamibiaNauruNepalNew CaledoniaNicaraguaNigerNigeriaNorth AmericaOECD membersOmanOther small statesPacific island small statesPakistanPalauPanamaPapua New GuineaParaguayPeruPhilippinesQatarRwandaSamoaSao Tome and PrincipeSaudi ArabiaSenegalSerbiaSeychellesSierra LeoneSingaporeSloveniaSmall statesSolomon IslandsSomaliaSouth AfricaSouth AsiaSouth Asia (IDA & IBRD)South SudanSri LankaSt. Kitts and NevisSt. LuciaSt. Vincent and the GrenadinesSub-Saharan Africa Sub-Saharan Africa (excluding high income)Sub-Saharan Africa (IDA & IBRD countries)SudanSurinameSwazilandSyrian Arab RepublicTajikistanTanzaniaThailandTimor-LesteTogoTongaTrinidad and TobagoTunisiaTurkeyTurkmenistanTuvaluUgandaUkraineUpper middle incomeUruguayUzbekistanVanuatuVenezuela, RBVietnamWest Bank and GazaWorldYemen, Rep.ZambiaZimbabwe Timeline:
This timeline shows a graph from 1961 to 2015 of Colombia. No data until 1960. Number of actual observations by date: 55.
Source name:
World Development Indicators
Source organization:
Development Assistance Committee of the Organisation for Economic Co-operation and Development, Geographical Distribution of Financial Flows to Developing Countries, Development Co-operation Report, and International Development Statistics database. Data are available online at: www.oecd.org/dac/stats/idsonline. World Bank GNI estimates are used for the denominator.
Categories, topics:
Aid Effectiveness, Economy & Growth, External Debt
Last updated:
apr 23, 2017
Indicators value changes by year
Minimum:
-0.284
jan 1, 1961
At the date of observation
Value
Absolute change
Change from previous value
jan 1, 1961
-0.284
-0.284
0.0%
jan 1, 1962
1.006
+1.29
-453.58%
jan 1, 1963
0.944
-0.061
-6.1%
jan 1, 1964
1.558
+0.614
65.03%
jan 1, 1965
0.918
-0.641
-41.11%
jan 1, 1966
0.649
-0.269
-29.31%
jan 1, 1967
1.726
+1.077
166.08%
jan 1, 1968
1.948
+0.222
12.87%
jan 1, 1969
3.275
+1.327
68.12%
jan 1, 1970
1.921
-1.354
-41.35%
jan 1, 1971
2.29
+0.37
19.24%
jan 1, 1972
1.703
-0.587
-25.64%
jan 1, 1973
1.416
-0.287
-16.83%
jan 1, 1974
1.457
+0.041
2.88%
jan 1, 1975
0.874
-0.583
-40.02%
jan 1, 1976
0.646
-0.228
-26.11%
jan 1, 1977
0.501
-0.145
-22.46%
jan 1, 1978
0.252
-0.249
-49.69%
jan 1, 1979
0.308
+0.056
22.3%
jan 1, 1980
0.194
-0.114
-36.97%
jan 1, 1981
0.271
+0.076
39.31%
jan 1, 1982
0.282
+0.011
4.05%
jan 1, 1983
0.254
-0.028
-9.83%
jan 1, 1984
0.229
-0.025
-9.92%
jan 1, 1985
0.239
+0.01
4.3%
jan 1, 1986
0.184
-0.055
-22.84%
jan 1, 1987
0.187
+0.003
1.81%
jan 1, 1988
0.223
+0.036
19.15%
jan 1, 1989
0.166
-0.057
-25.64%
jan 1, 1990
0.18
+0.014
8.14%
jan 1, 1991
0.232
+0.052
29.09%
jan 1, 1992
0.288
+0.056
24.12%
jan 1, 1993
0.491
+0.203
70.51%
jan 1, 1994
0.155
-0.336
-68.47%
jan 1, 1995
0.093
-0.062
-40.09%
jan 1, 1996
0.186
+0.093
100.48%
jan 1, 1997
0.196
+0.011
5.75%
jan 1, 1998
0.186
-0.01
-5.28%
jan 1, 1999
0.173
-0.013
-7.15%
jan 1, 2000
0.356
+0.183
106.13%
jan 1, 2001
0.19
-0.166
-46.59%
jan 1, 2002
0.401
+0.211
110.92%
jan 1, 2003
0.46
+0.059
14.63%
jan 1, 2004
0.875
+0.415
90.25%
jan 1, 2005
0.455
-0.42
-47.95%
jan 1, 2006
0.439
-0.016
-3.59%
jan 1, 2007
0.641
+0.202
45.89%
jan 1, 2008
0.362
-0.279
-43.5%
jan 1, 2009
0.415
+0.053
14.54%
jan 1, 2010
0.47
+0.055
13.33%
jan 1, 2011
0.245
-0.225
-47.94%
jan 1, 2012
0.317
+0.072
29.53%
jan 1, 2013
0.215
-0.102
-32.11%
jan 1, 2014
0.233
+0.018
8.47%
jan 1, 2015
0.334
+0.101
43.08%
Ranking of countries by current statistics by years


Comments: